- The top six NASDAQ stocks are the tech giants
- The risk for the NASDAQ could sit in Washington, DC
- The best performing sector in 2020
- A rough start to March for technology
- Trading the potential for a tech wreck with the SQQQ
The writing may be on the wall for the technology sector. In 2020, tech stocks were all the rage. In 2021, some air has come out of the bullish balloons. Meanwhile, the leading technology companies could wind up being victims of their success.
There is a rising wave of discontent with the companies that have changed our world. They have grown so large that politicians and regulators are more than concerned with their swollen market caps and cash hordes that lead to anti-competitive practices. Management’s job is to increase the return for all shareholders.
However, when a company has a dominant position, it becomes more than a balancing act to avoid violating antitrust rules and regulations. Moreover, the power comes from intimate knowledge about consumer behavior patterns coming from processing data. Technology leaders have become data powerhouses that raise substantial privacy issues.
The stocks that exploded to new highs in 2020 because they combined technology with essential consumer needs during the pandemic face increasing scrutiny because of their wealth and power in 2021. A tech wreck could be on the horizon as governments look to put a leash on activities with taxes and regulatory reforms that erode their earnings power.
The ProShares UltraPro Short QQQ (SQQQ - Get Rating) is a trading tool that could offer short-term exponential gains if a tech wreck develops over the coming weeks and months.
The top six NASDAQ stocks are the tech giants
While the list tends to shift based on share prices, the top six NASDAQ stocks are the well-known leaders of the technology sector.
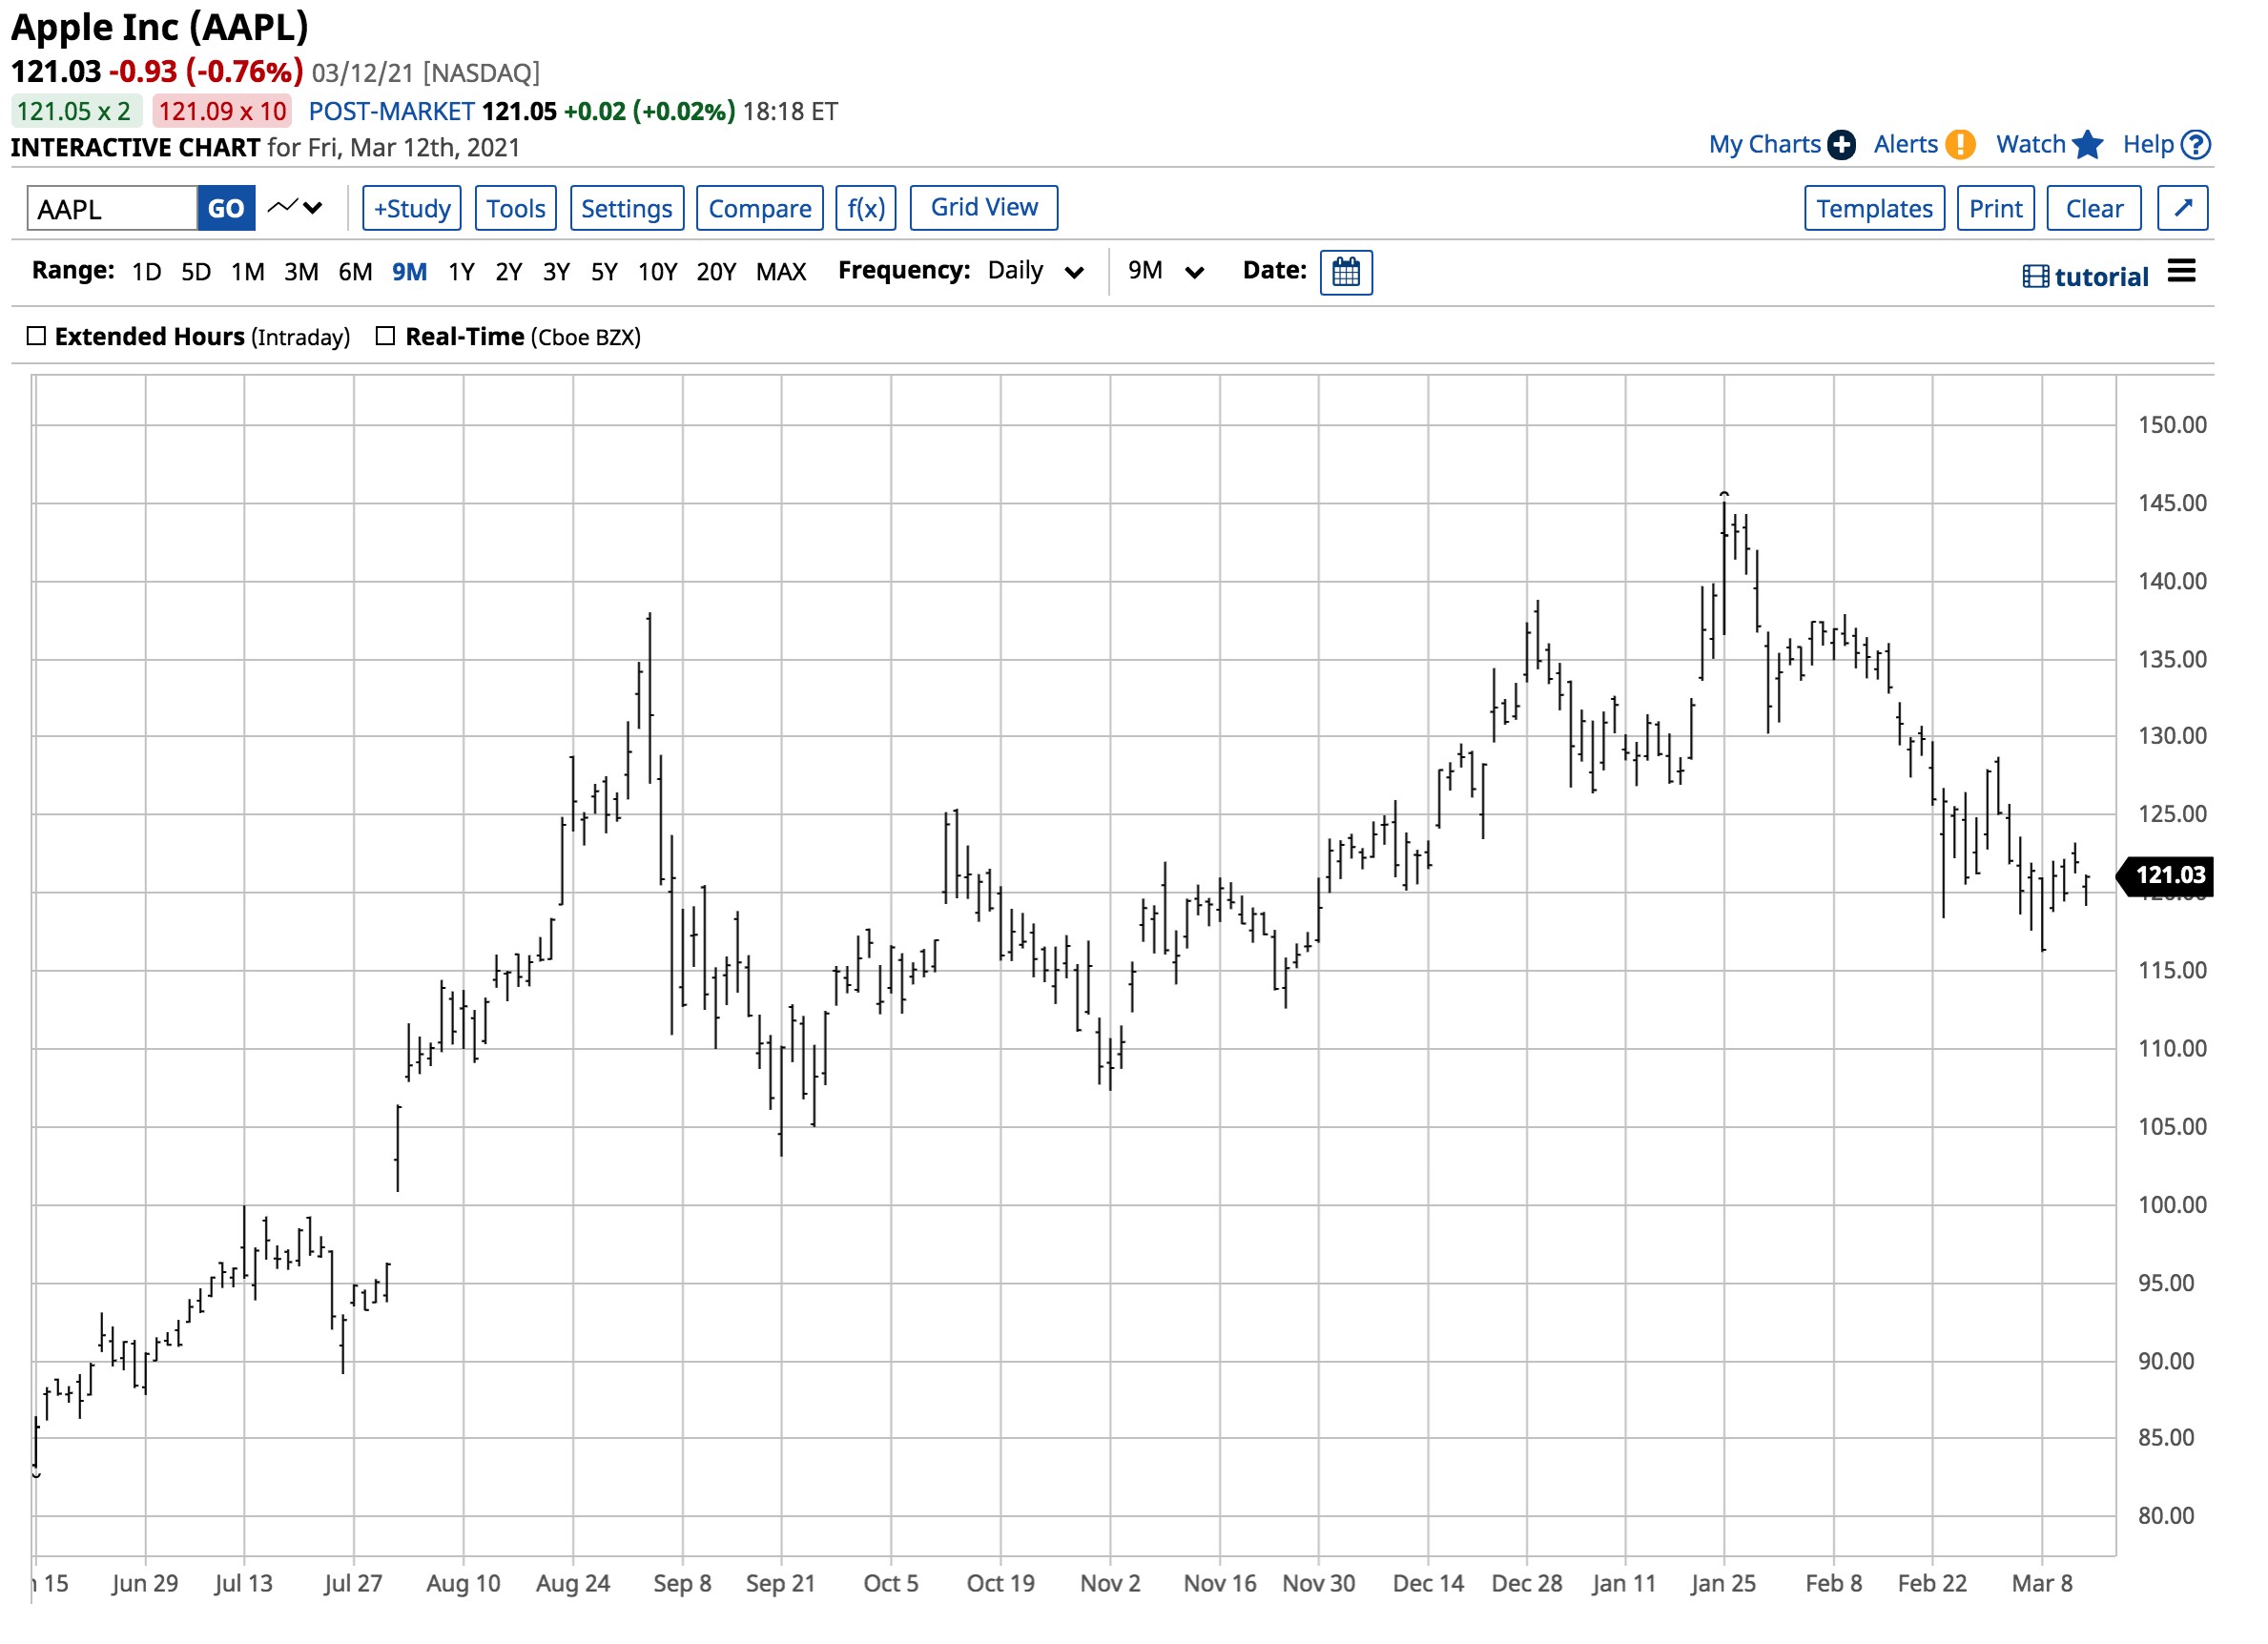
Apple Inc. (AAPL - Get Rating), at the $121.03 per share level at the end of last week, had a market cap of just over $2 trillion, making it the leader of the NASDAQ pack.
 Source: Barchart
After reaching an all-time high of $145.09 per share on January 25, at $121.03, AAPL has corrected by 16.6% from its peak.
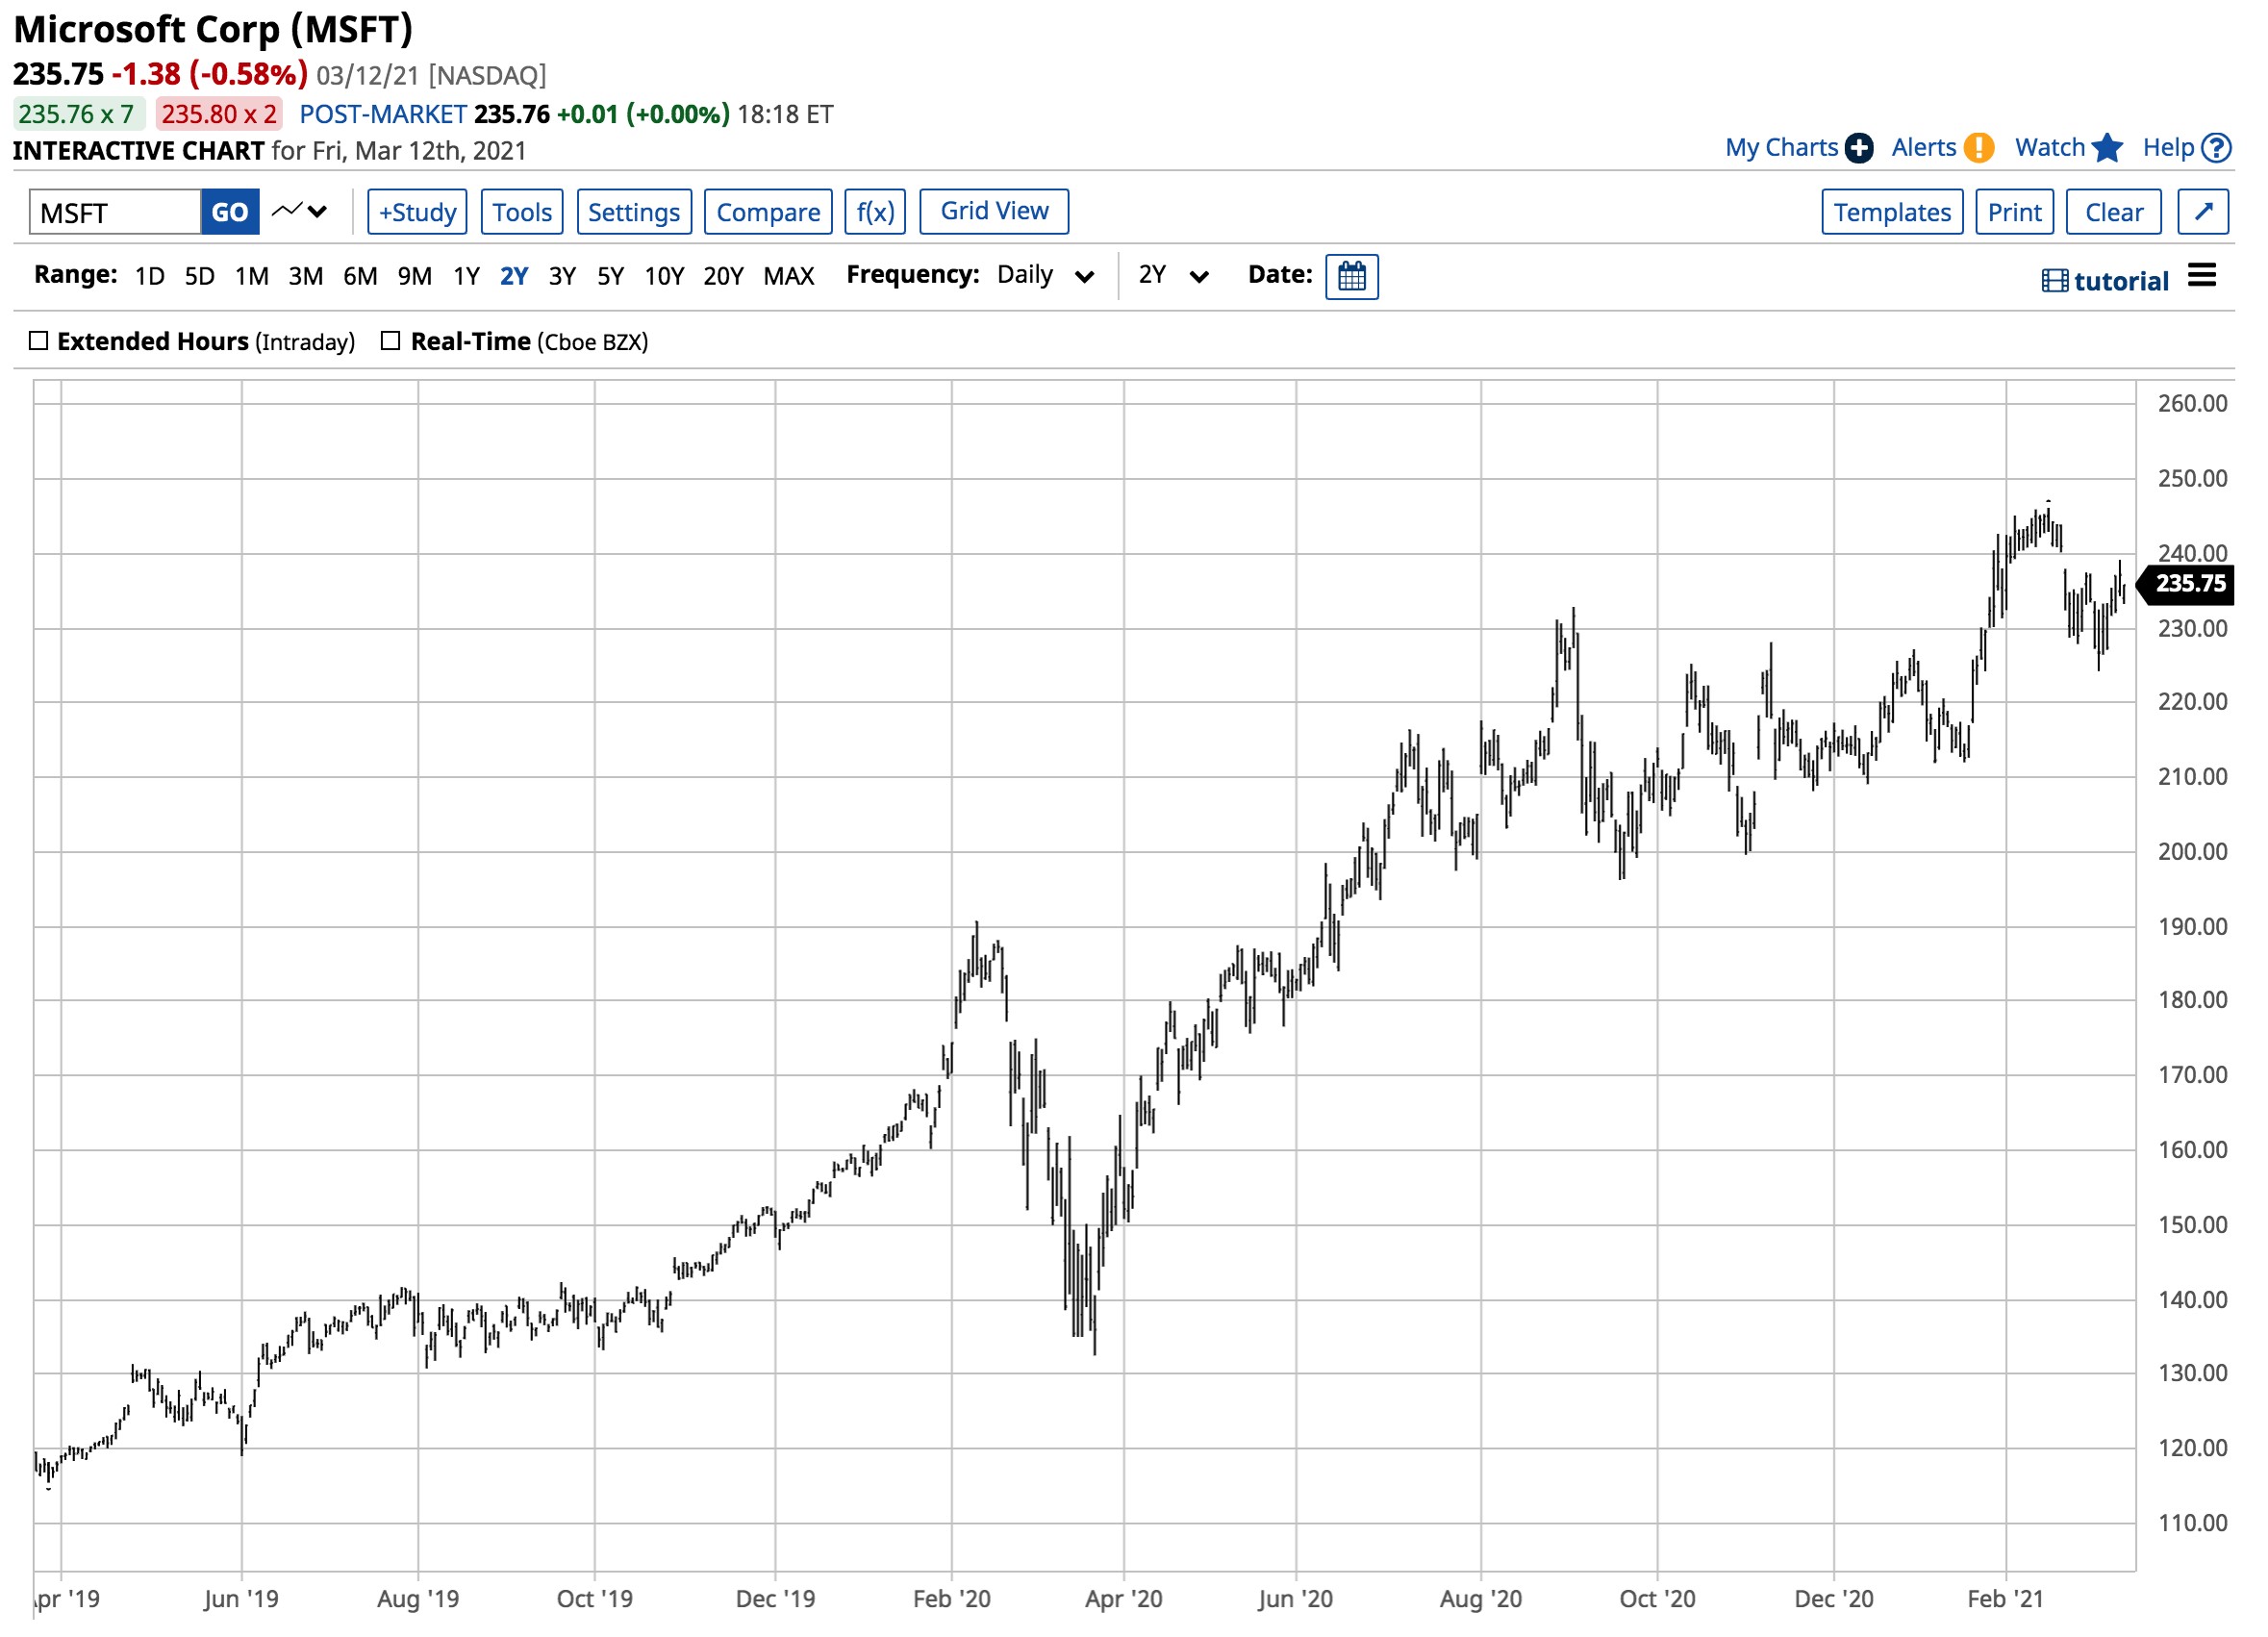
Microsoft (MSFT - Get Rating), with a $1.778 trillion market cap, was at the $235.75 level on March 12.
 Source: Barchart
MSFT’s all-time peak came on February 16 at $246.13 per share. While the stock has backed off, it was only 4.22% below the record high at the end of last week.
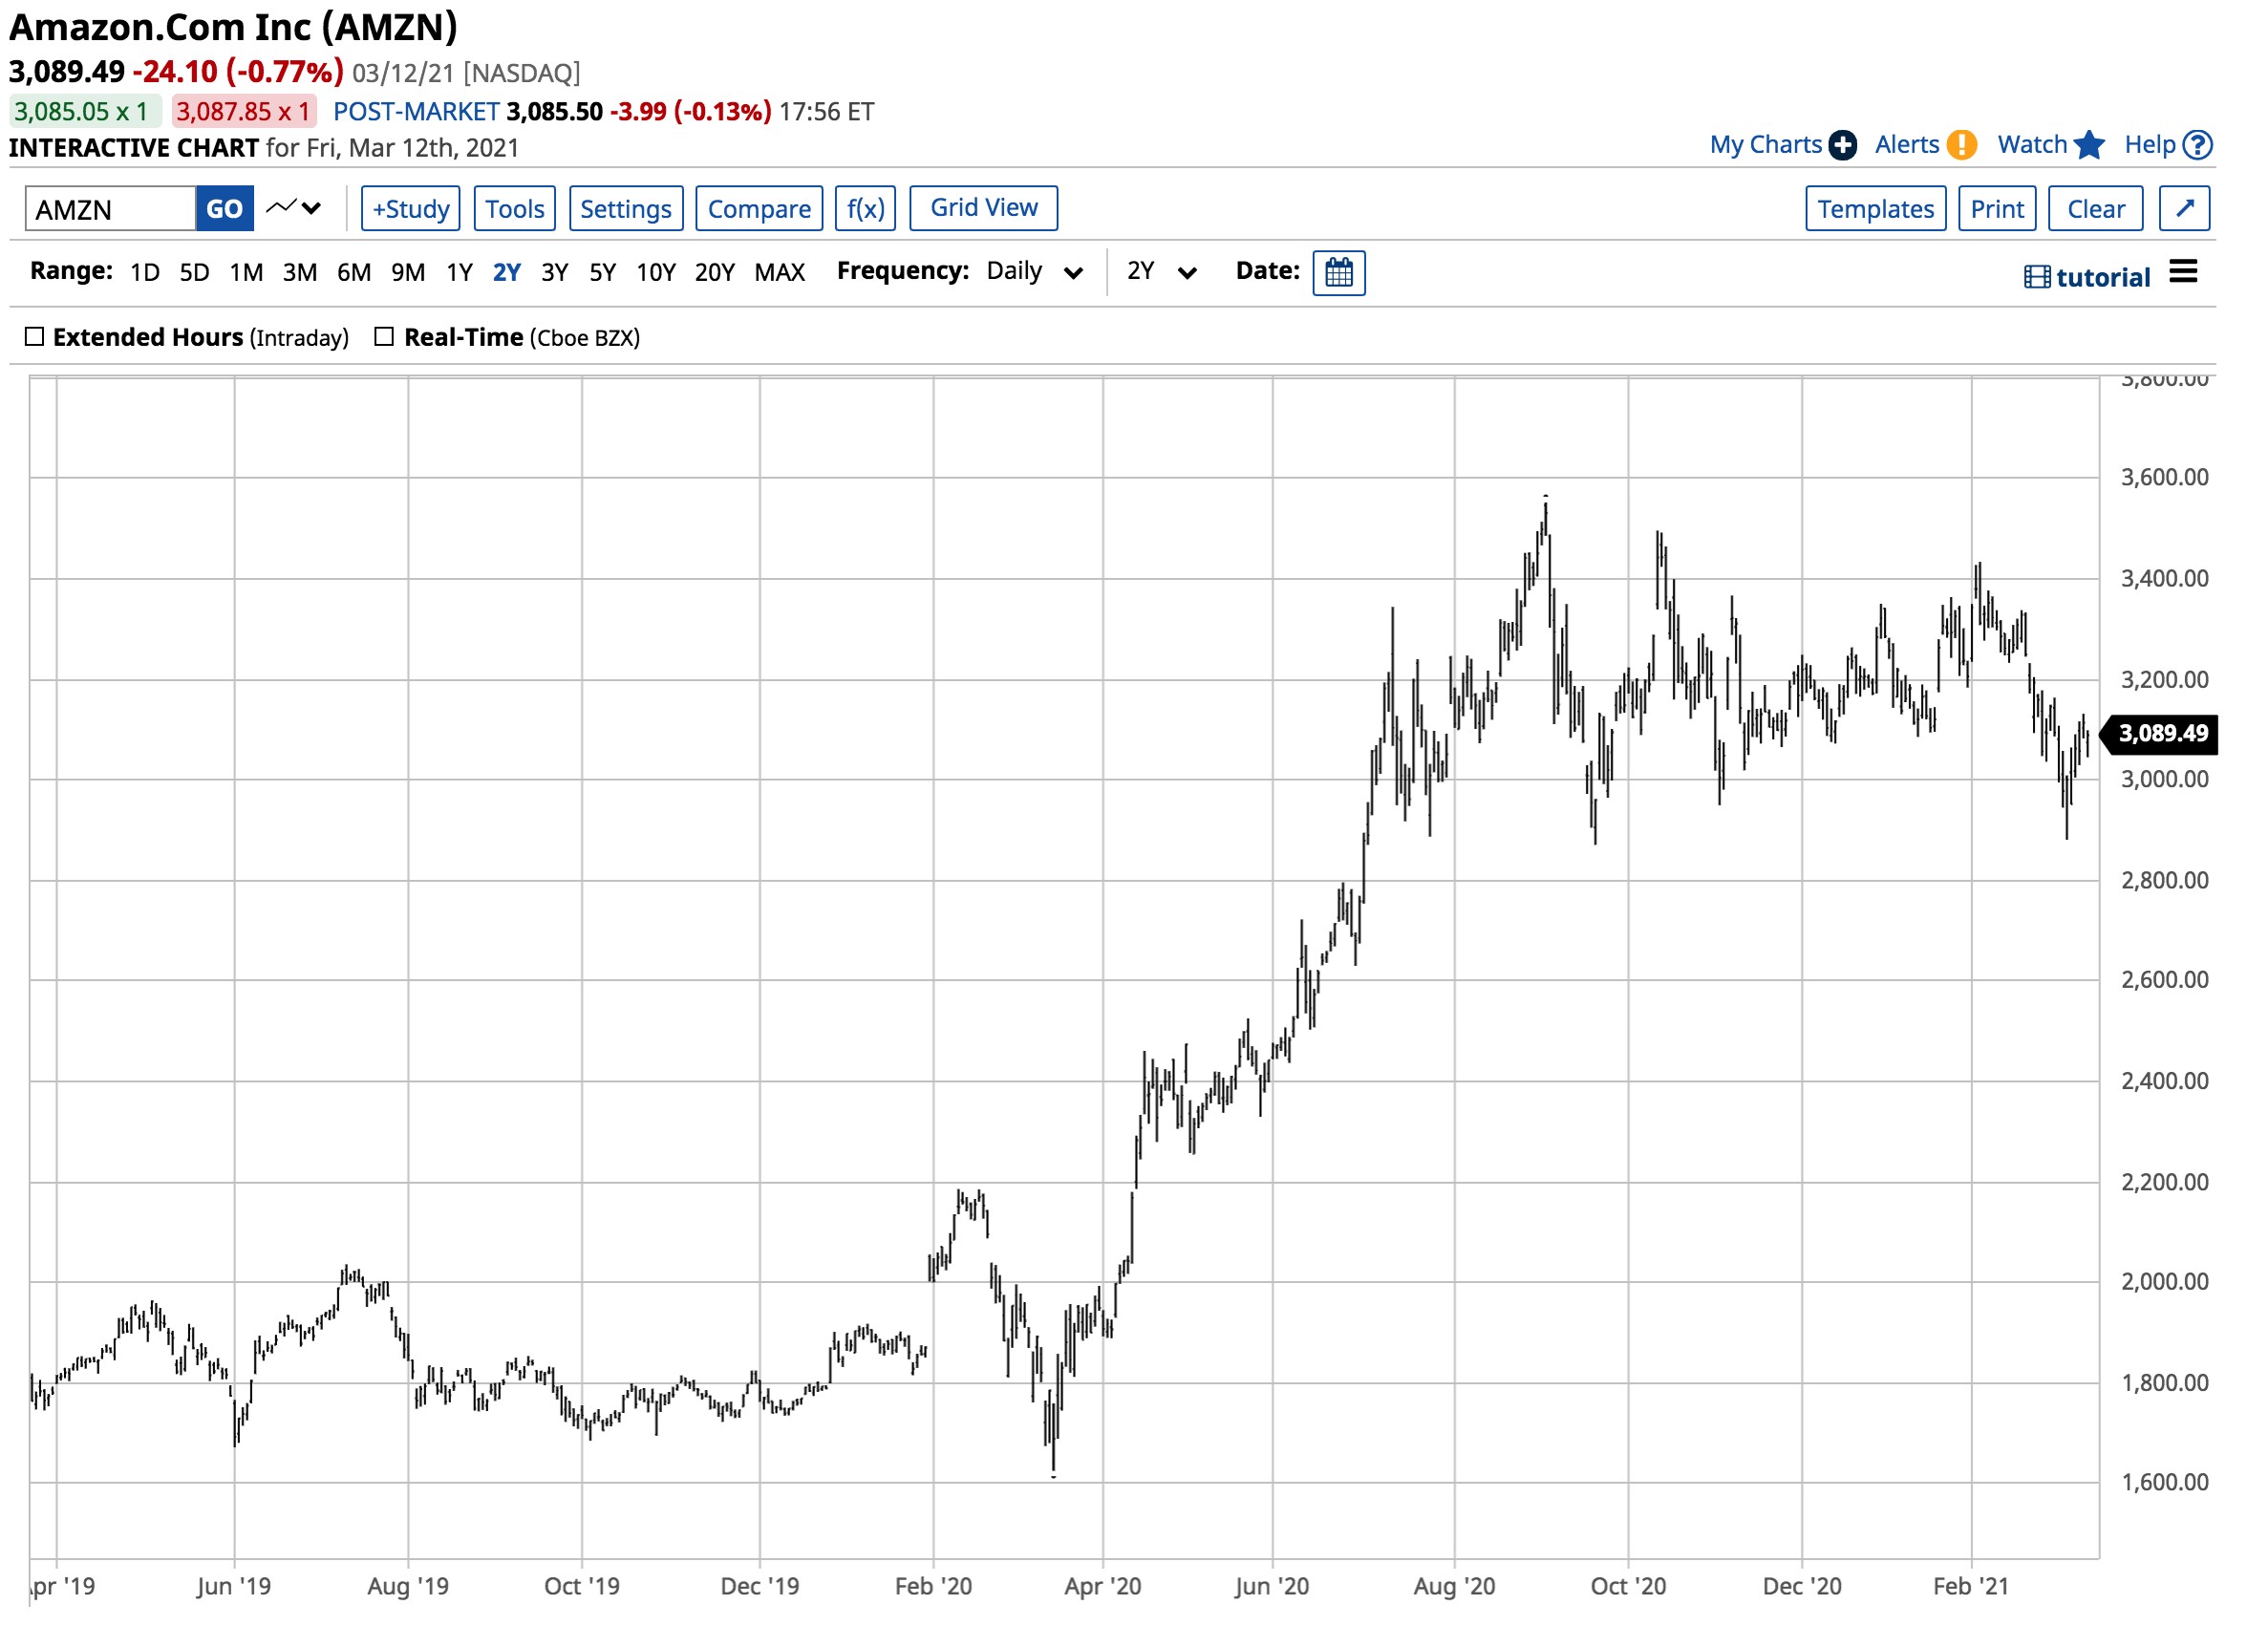
The third leading NASDAQ stock was e-commerce giant Amazon.com (AMZN - Get Rating). At $3089.49 per share, its market cap was at the $1.556 trillion level.
 Source: Barchart
After reaching its record high of $3,552.25 on September 2, 2020, AMZN shares have declined by 13.11%, putting a dent in the pocketbook of the world’s wealthiest person, AMZN’s founder Jeff Bezos.
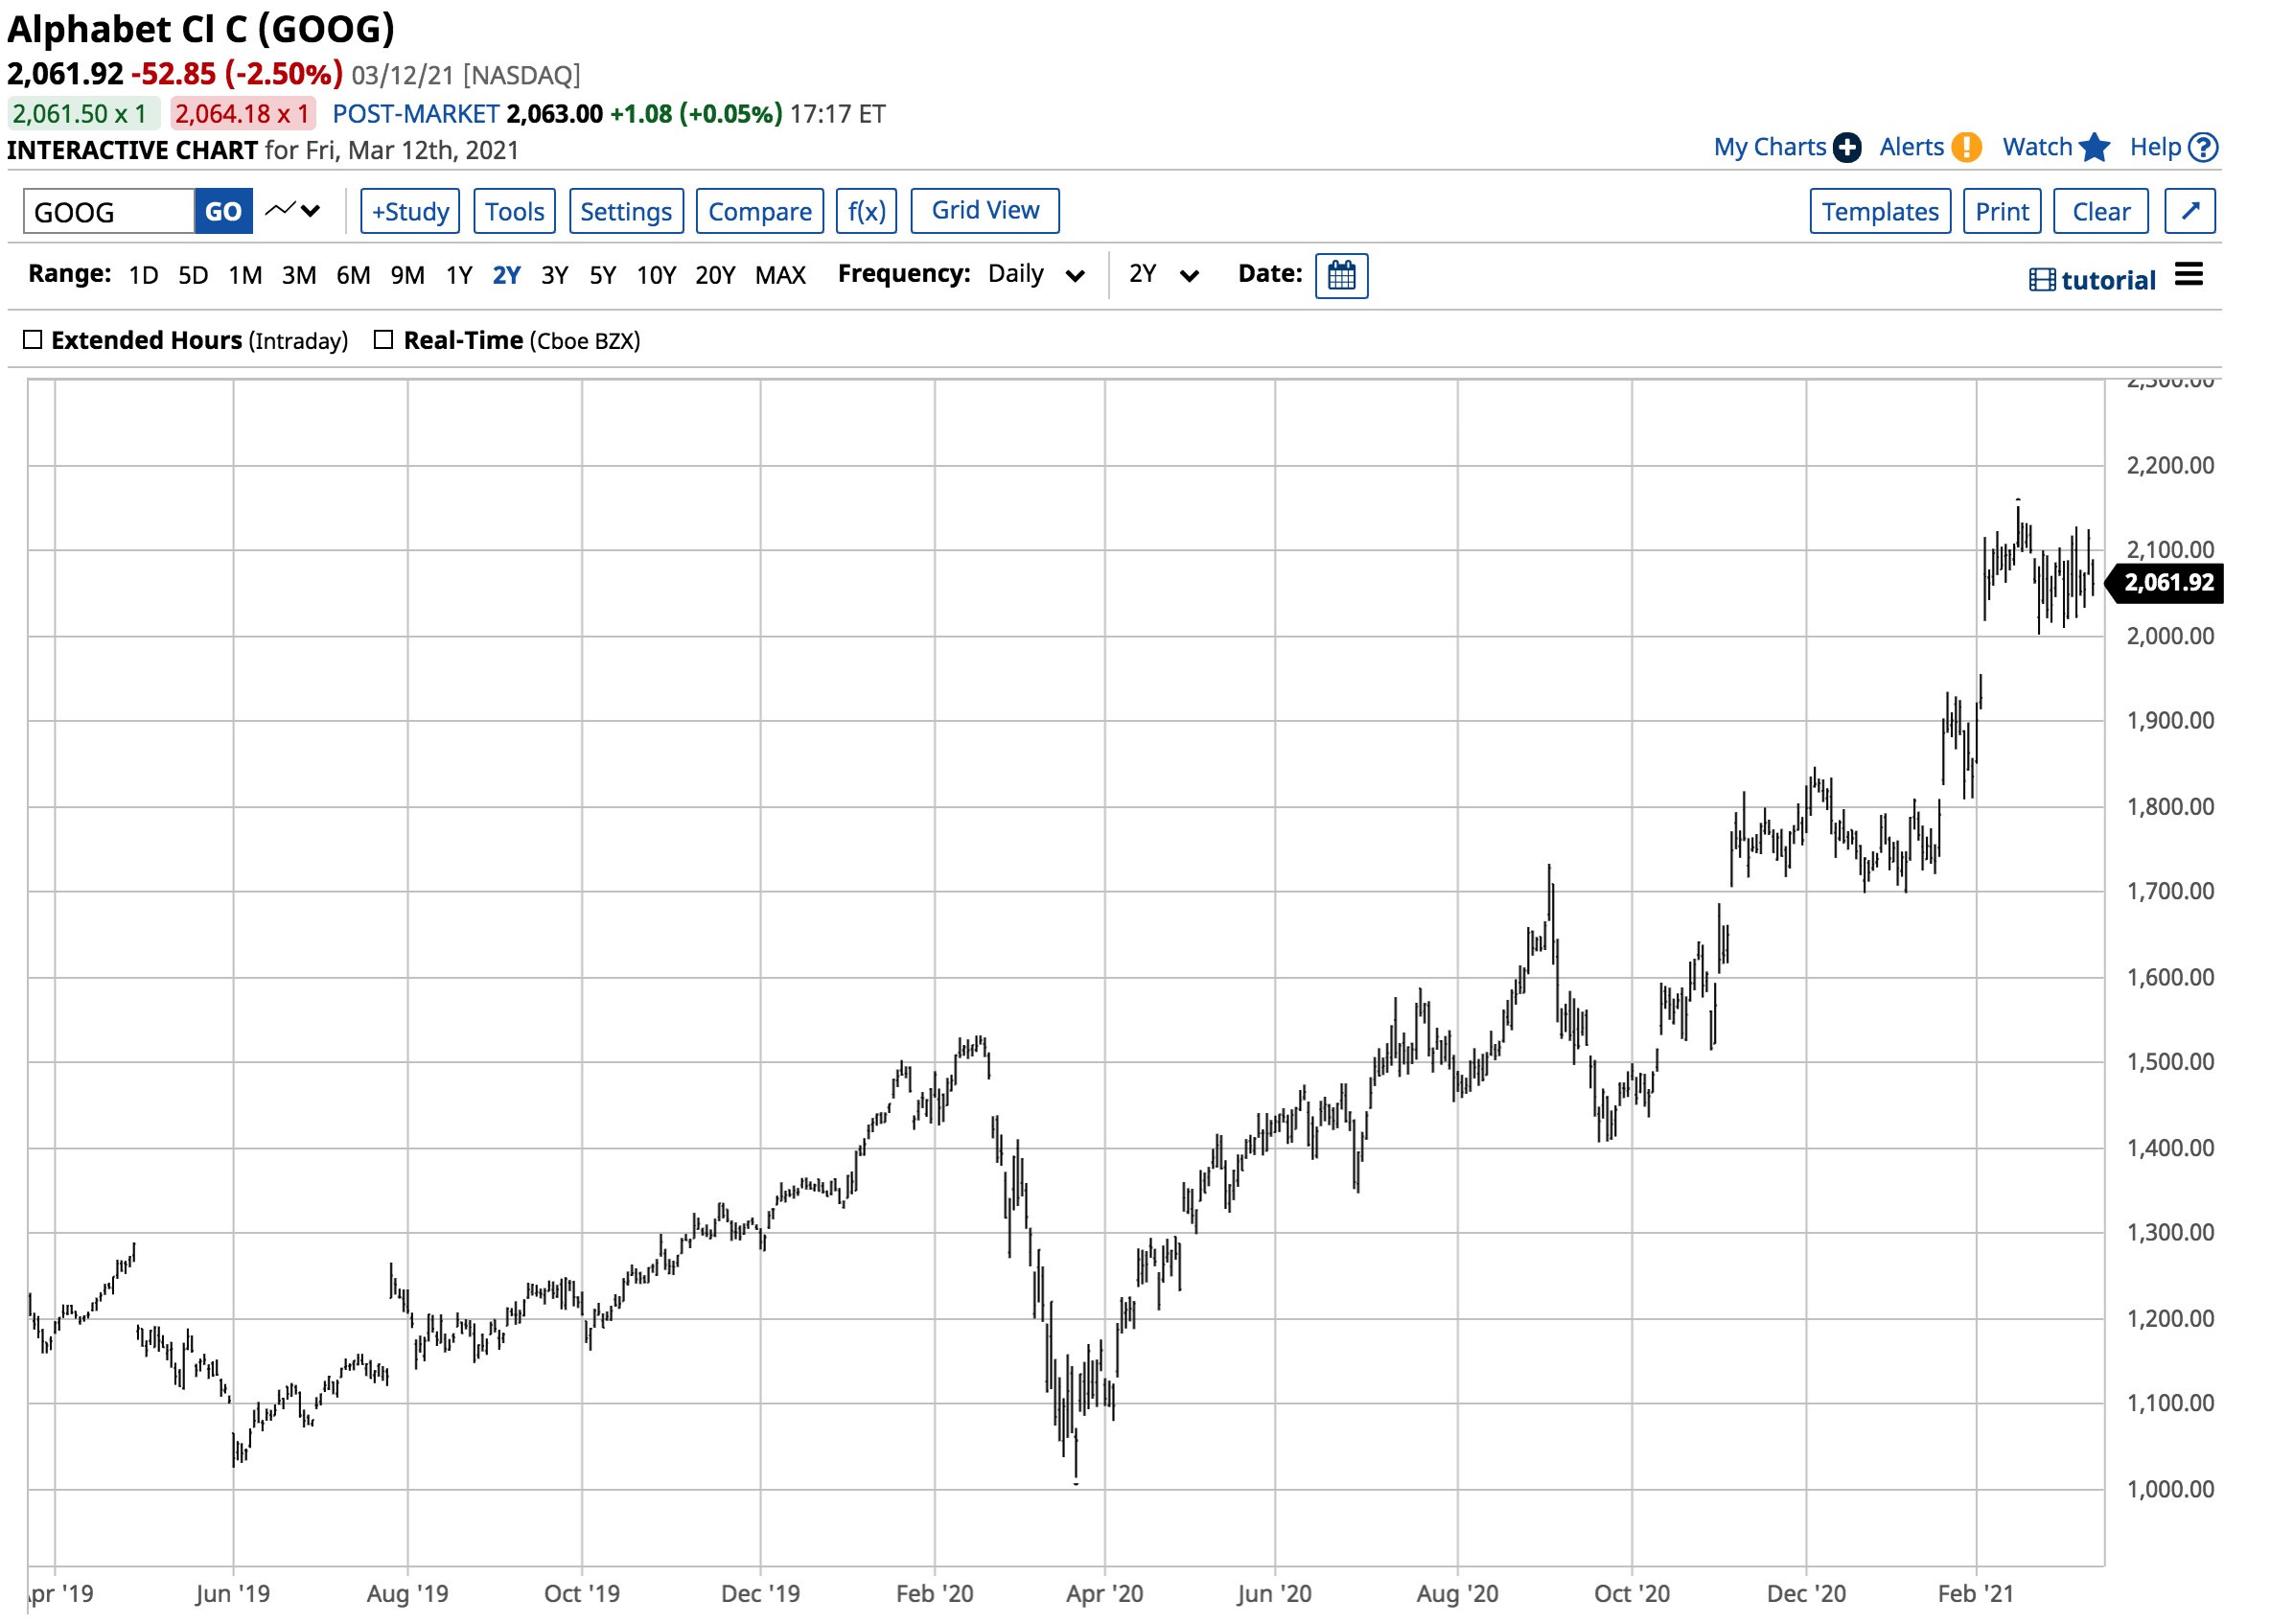
Alphabet (GOOG) is next on the NASDAQ’s leadership board with a $1.385 market cap at $2,061.92 per share.
 Source: Barchart
GOOG shares reached a high of $2,152.68 on February 16. On March 15, the shares were 4.22% lower.
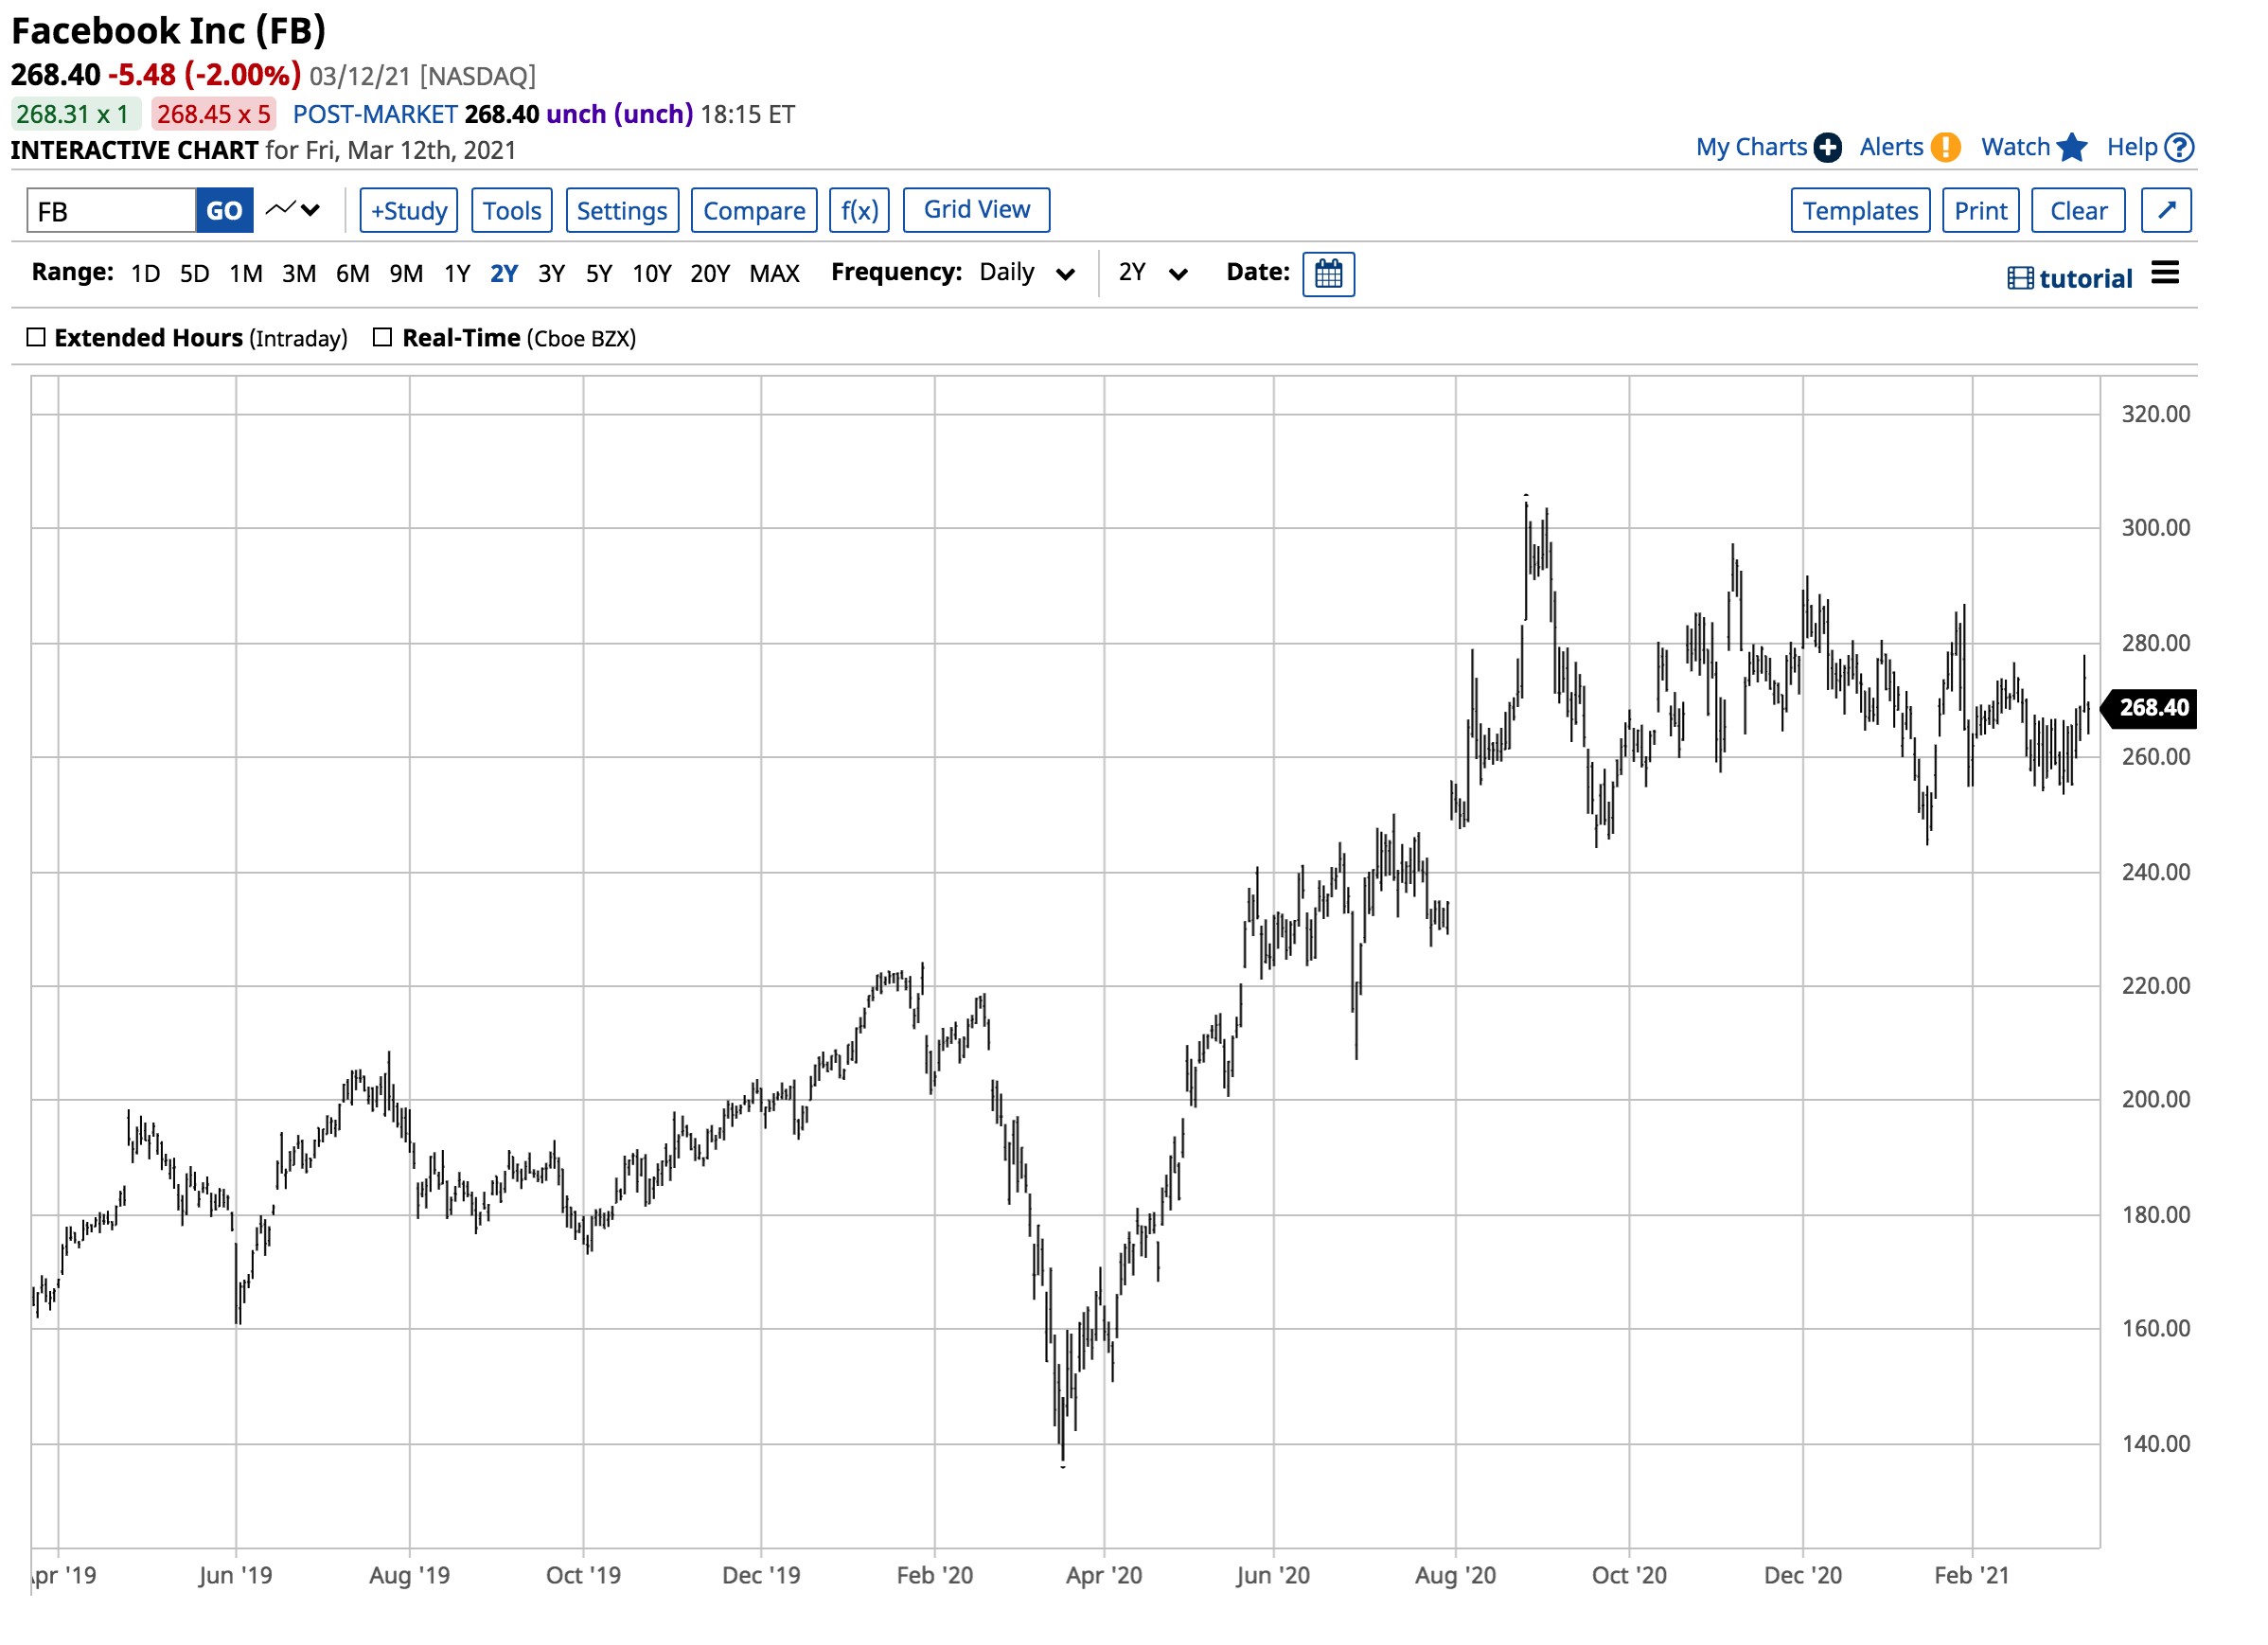
Mark Zuckerberg’s Facebook (FB) is next up on the list of the NASDAQ’s leaders with a $764.315 billion market cap at the $268.40 per share level.
 Source: Barchart
As the chart illustrates, FB shares hit a high of $304.67 on August 26, 2020, and were 11.9% below that level on March 12.
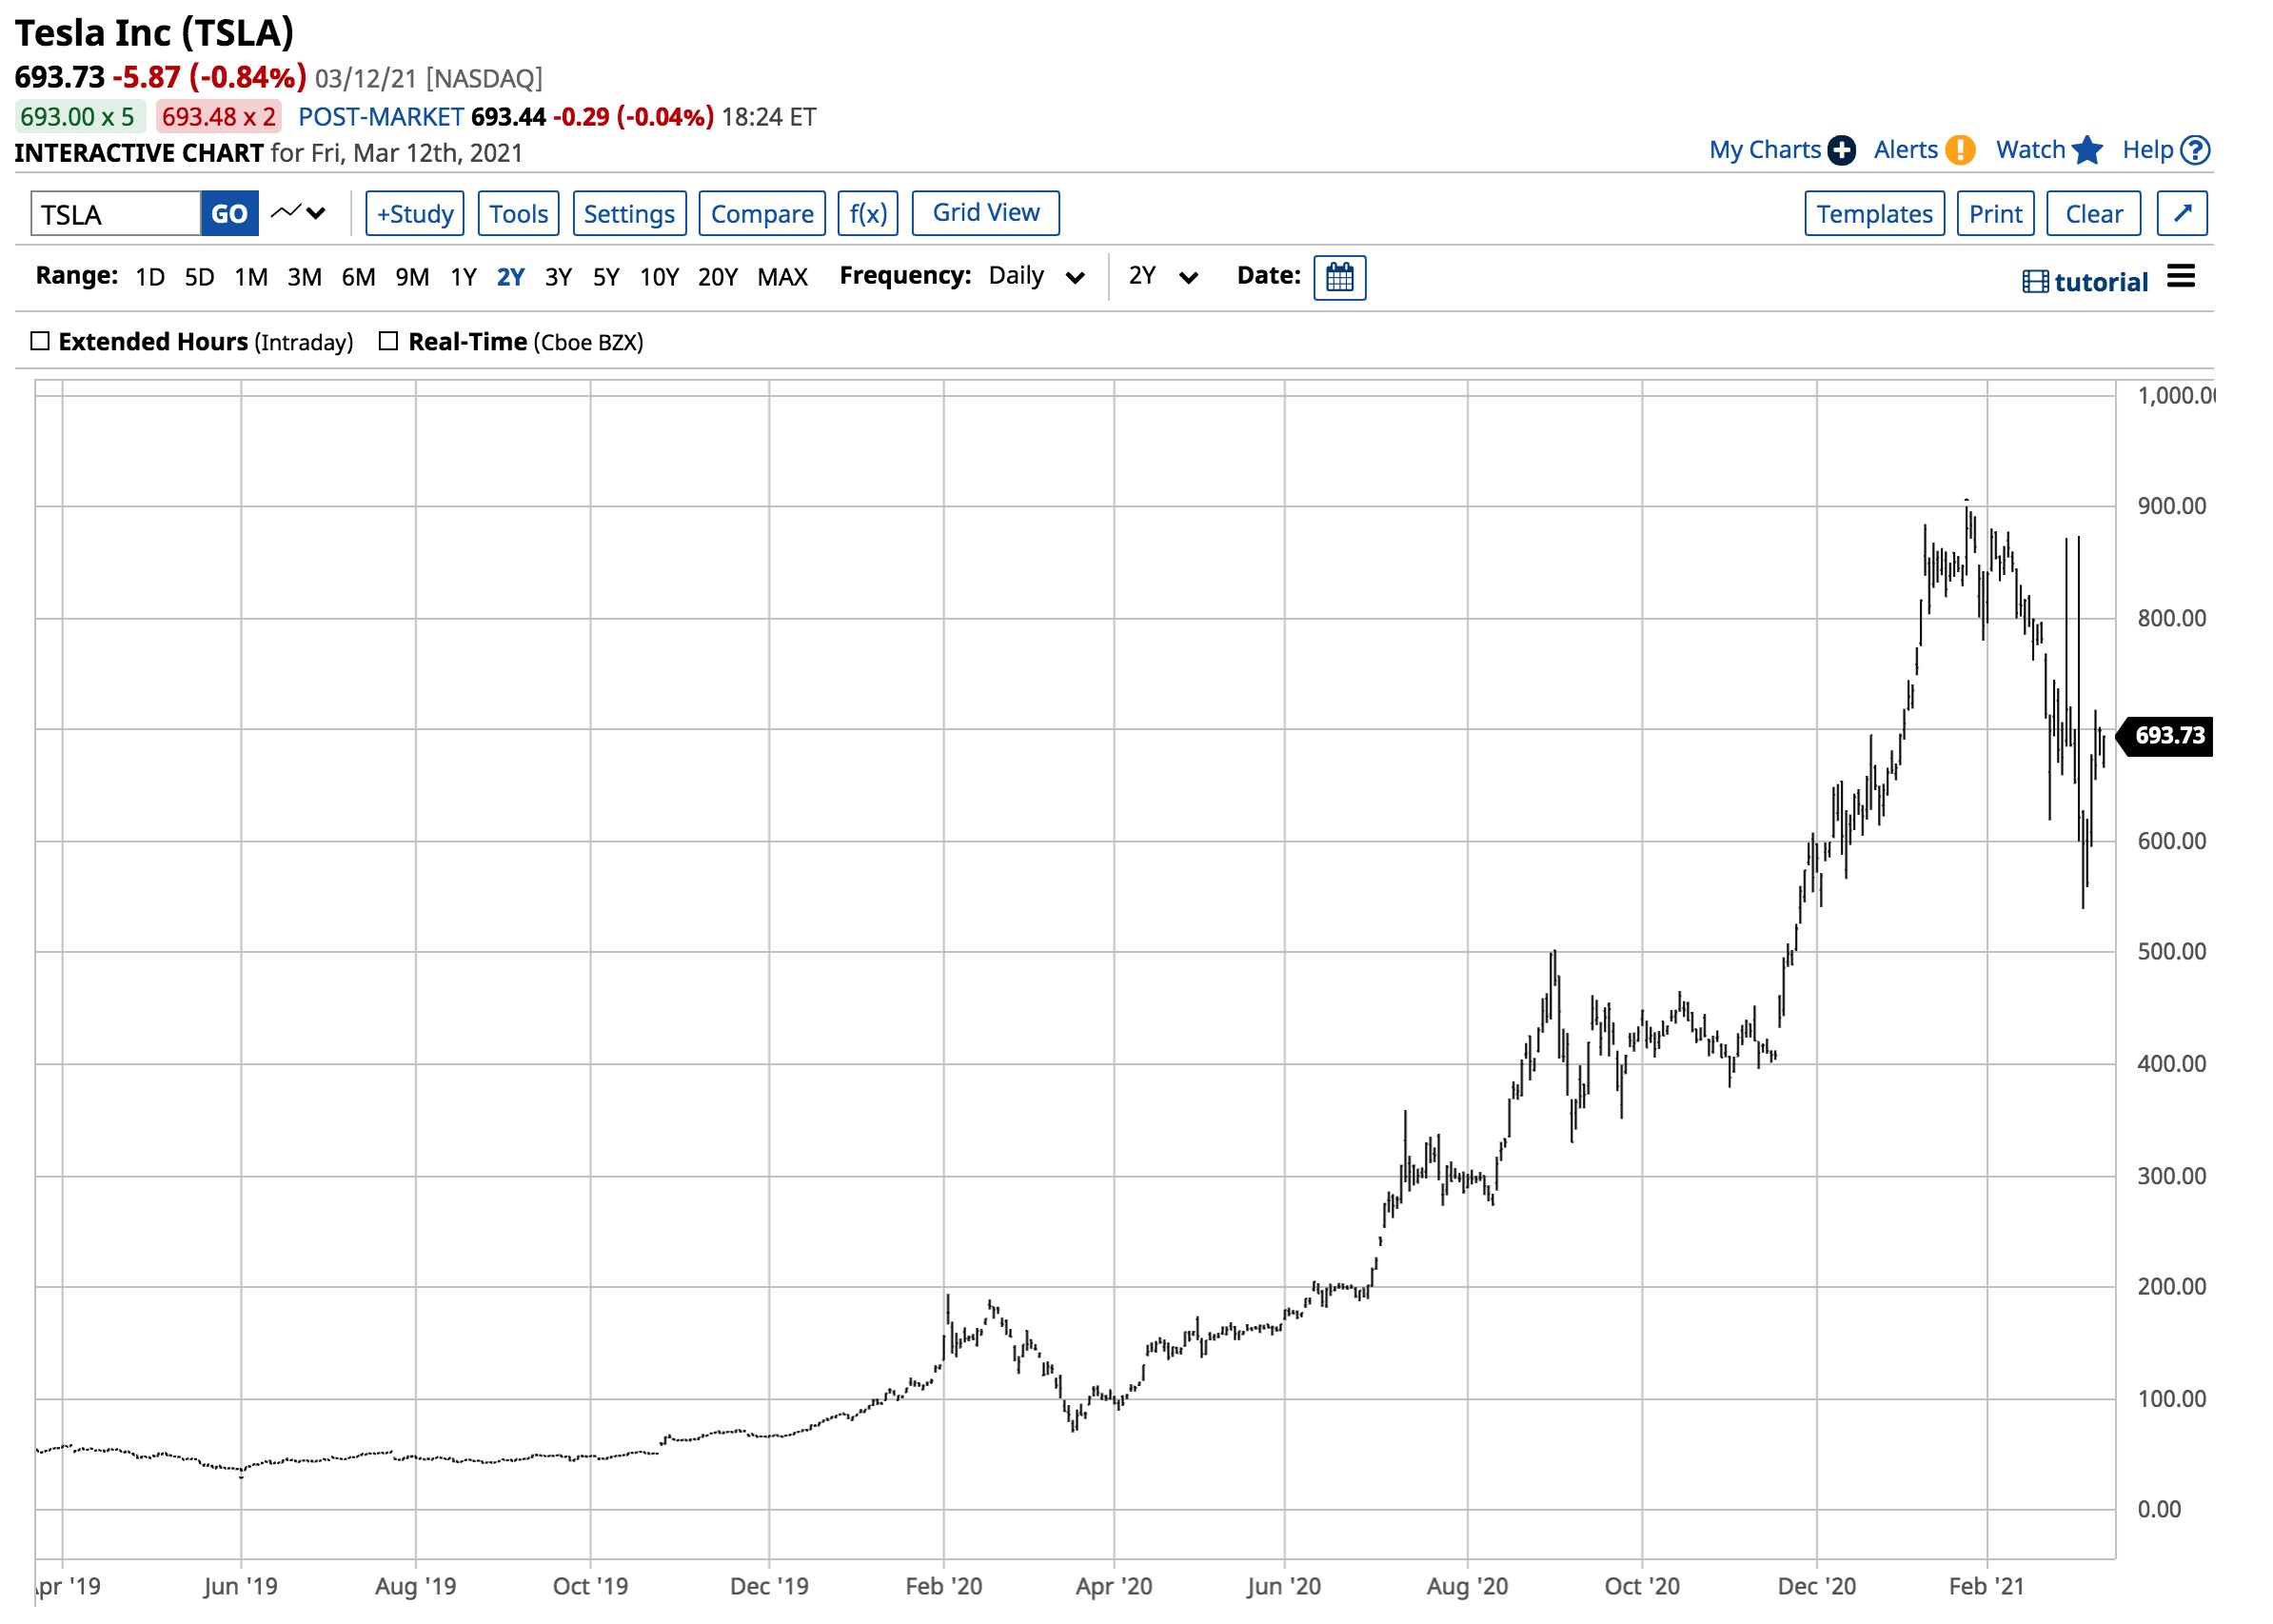
Finally, Tesla (TSLA) is the most volatile of the six stocks with a market cap of around $665.88 billion, with the stock at the $693.73 per share level.
 Source: Barchart
TSLA shares reached a record peak of $900.40 on January 25, 2021 and corrected by 22.95% at the end of last week.
The six NASDAQ leaders with a combined market cap of nearly $8.15 trillion have been making lower highs over the past weeks.
The risk for the NASDAQ could sit in Washington, DC
Technology companies are in the crosshairs of many politicians sitting in Washington, DC, and in the halls of power in the European Union. Aside from their market caps, which put the leading companies in a dominant position compared to competitors, many also have access to data that worries politicians.
The potential for regulatory changes that either break up some of the leading companies or rein in their powers could jeopardize earnings. Moreover, higher corporate taxes would take a bite out of earnings. When it comes to paying for the trillions in stimulus, it is not a question of if corporate tax rates are rising, but when and by how much they will rise.
Meanwhile, perhaps the most substantial threat comes from the potential for a wealth tax. Senator Elizabeth Warren is not giving up her pursuit of a tax on the wealthiest Americans. If she were to prevail, a tax on accumulated wealth would likely force founders and CEOs to sell part of their holdings to pay taxes.
A wealth tax could have a devastating impact on the stock market. With wealth concentrated in the technology sector, we could see the most dramatic effect on the leading tech companies that have made Tim Cook, Mark Zuckerberg, Elon Musk, and other tech-sector stars billionaires.
One of the biggest risks for the technology sector is the US and European governments.
The best performing sector in 2020
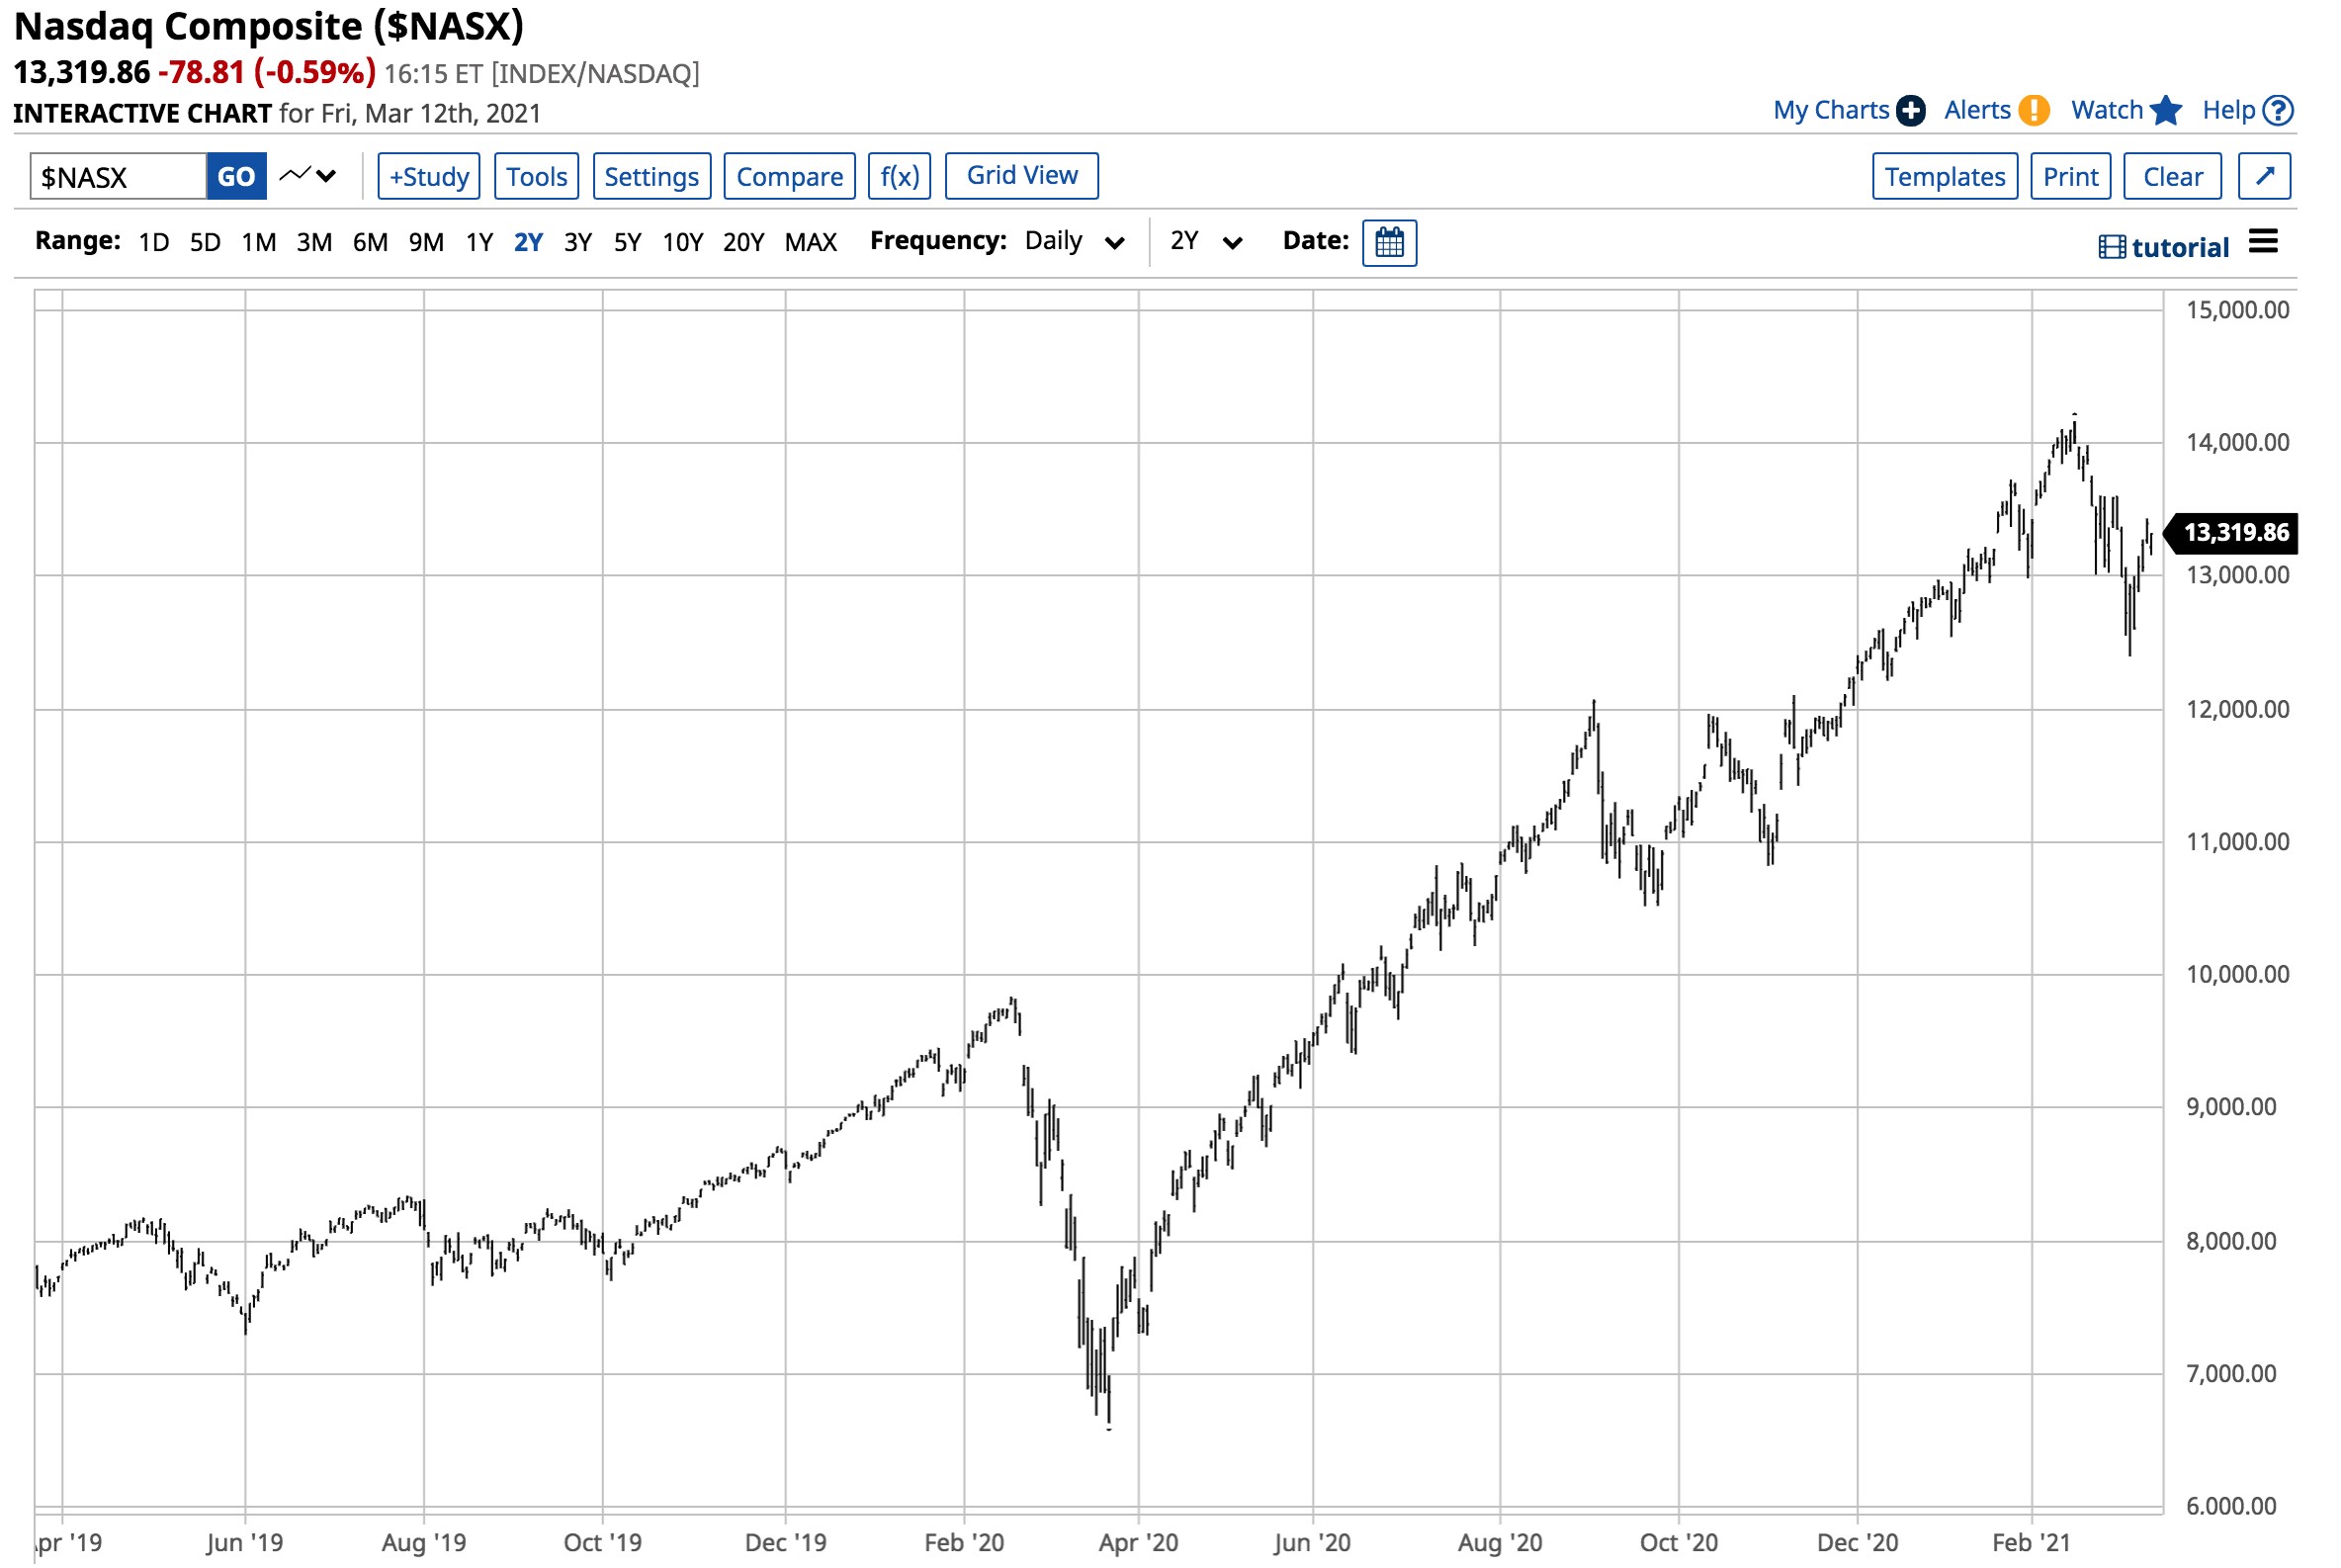
The NASDAQ Composite closed 2019 at the 8,972.60 level.
 Source: Barchart
As the chart highlights, the tech-heavy index closed at 12,888.28 on December 31, 2020, a gain of 43.64% in 2020. While the NASDAQ was 3.35% higher in 2021 as of March 12, with the index at 13,320, it peaked at 14,167.15 on February 16 and has made a pattern of lower highs and lower lows since mid-February.
A rough start to March for technology
Trends are always your best friends in markets across all asset classes.
 Source: Barchart
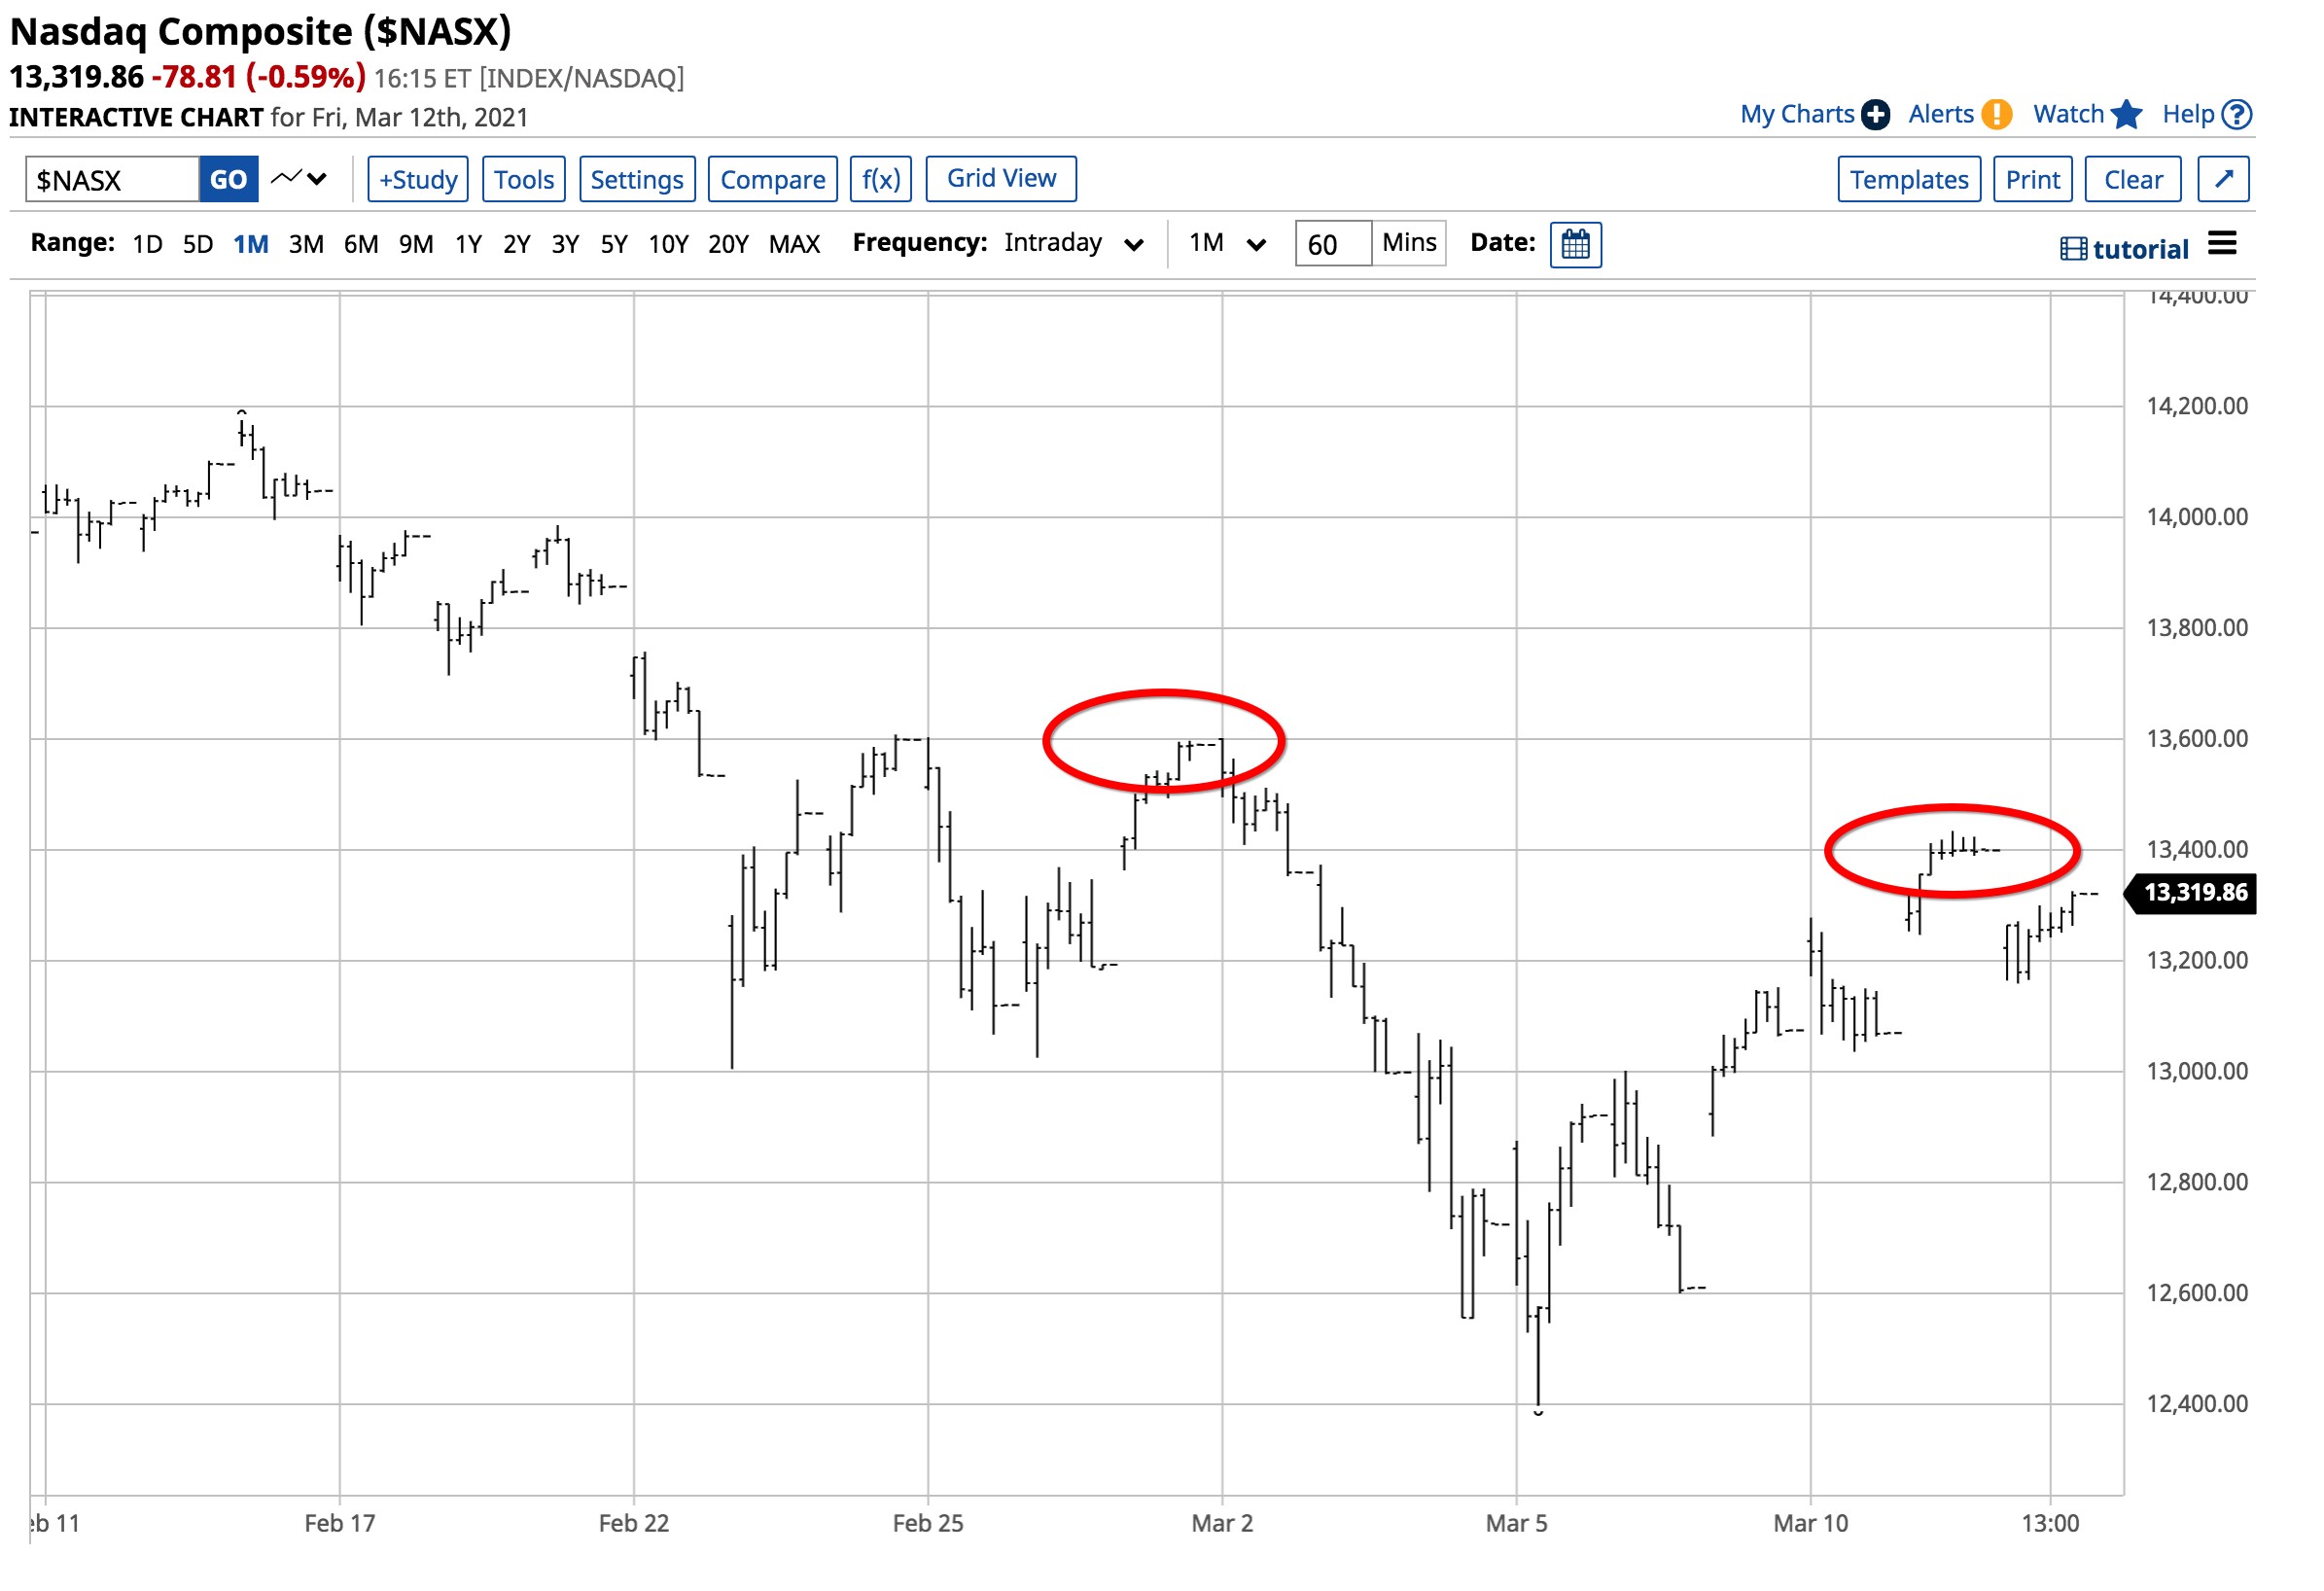
The short-term chart shows the pattern of lower highs and lower lows in the NASDAQ index since mid-February. The 13,600 level appears to be an area of congestion and technical resistance for the NASDAQ over the coming days and weeks. A move above the level would negate the negative price action, while a continuation of lower lows could cause a sudden and dramatic break to the downside. Any tech wreck that would likely cause other indices and markets to follow on the downside.
Trading the potential for a tech wreck with the SQQQ
It is impossible to pick tops or bottoms in any market. The best opportunity for success is following the price trends. Since mid-February, the trend in the tech-heavy NASDAQ remains lower. Rallies over the past weeks have stopped short of pushing the index above critical resistance levels that would negate the bearish price action.
The ProShares UltraPro Short QQQ (SQQQ - Get Rating) is a short-term, turbocharged, bearish product that moves higher as the NASDAQ declines. The top holdings and fund summary for SQQQ include:
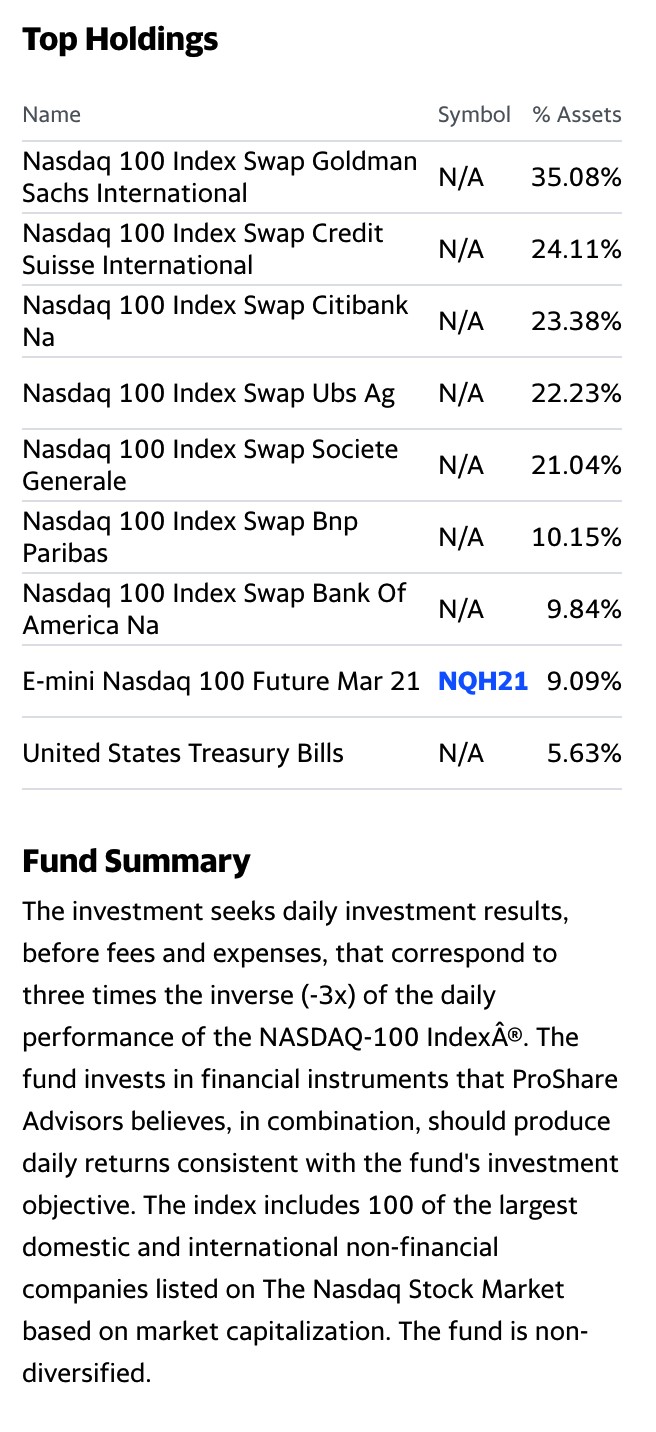 Source: Yahoo Finance
SQQQ has net assets of $1.69 billion, trades an average of over 84.27 million shares each day, and charges a 0.95% expense ratio.
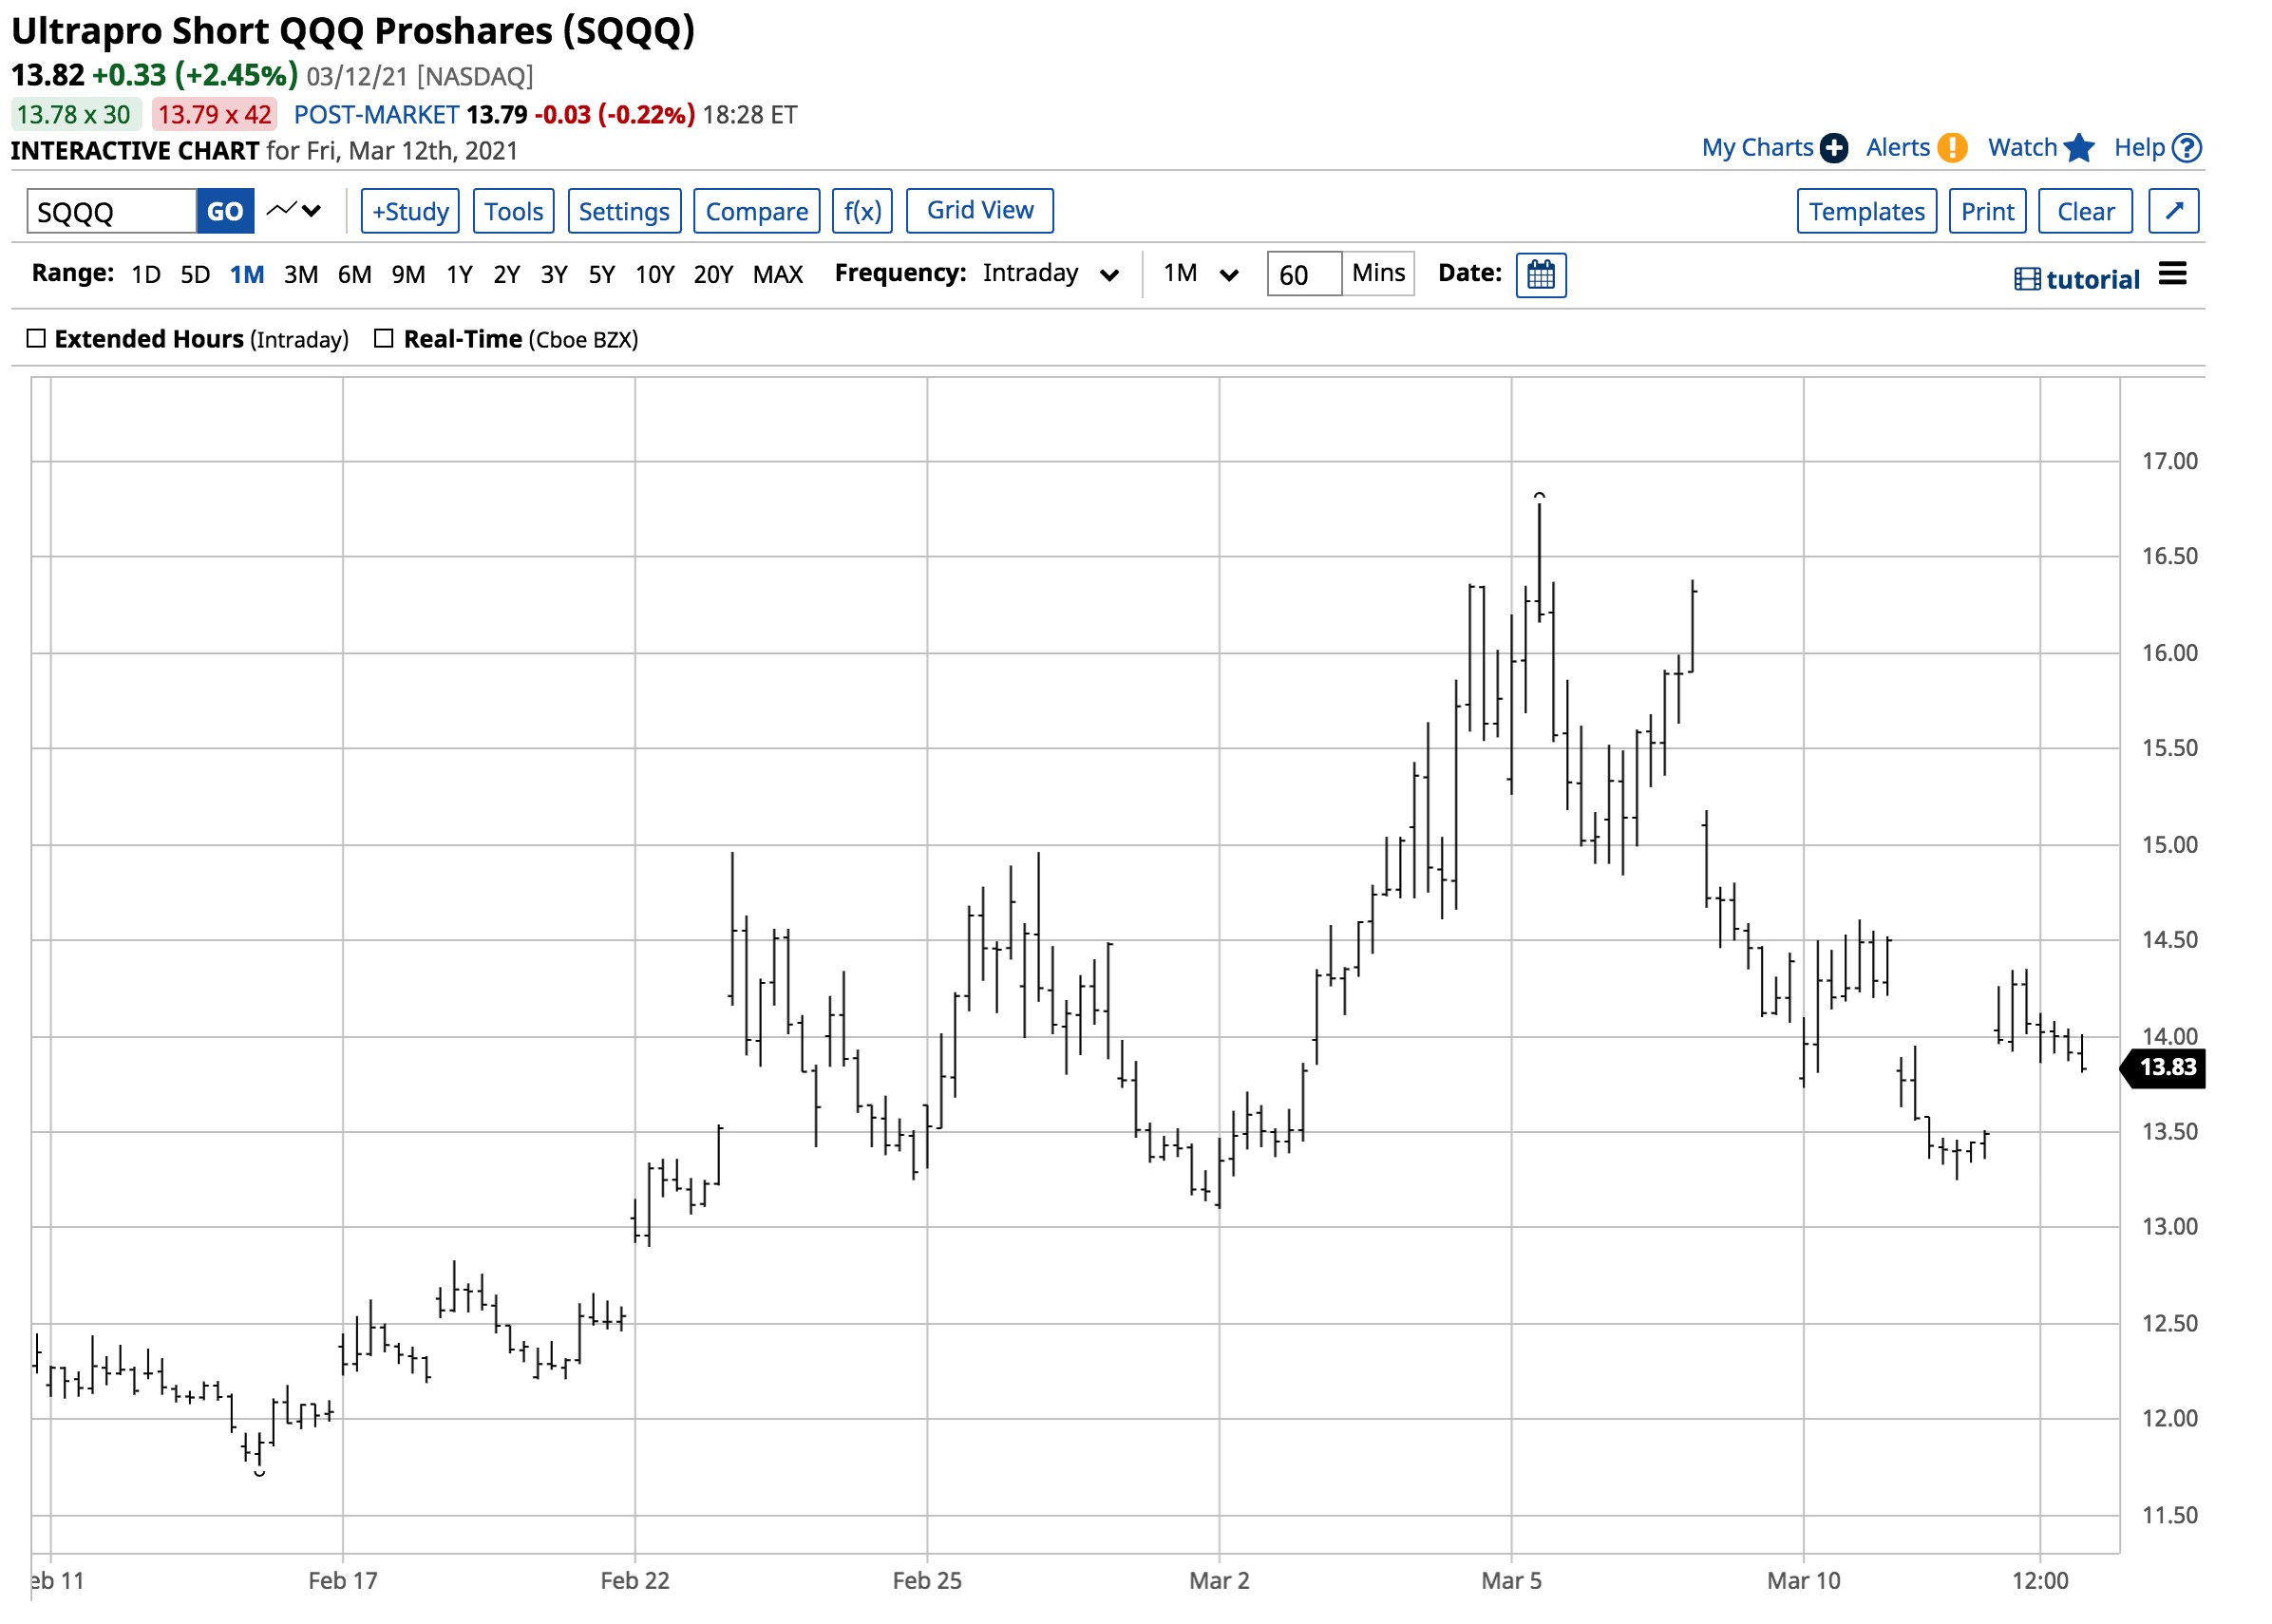
The NASDAQ index moved from 13,601.33 on March 2 to a low of 12,397.05 on March 5, a decline of 8.85%.
 Source: Barchart
Over the same period, SQQQ moved from $13.10 to $16.78 per share or 28.09% higher. SQQQ is a short-term trading product that will lose value if the QQQ and NASDAQ move higher or trade sideways. SQQQ’s leverage comes at a price, which is time decay. Timing is the most significant consideration when using this leveraged tool.
I favor buying SQQQ on bounces and rallies in the NASDAQ index with very tight stops and a plan for risk-reward that favors the profit side of the equation. If a tech wreck is on the horizon, we could see a series of downdrafts in the leading NASDAQ stocks. The SQQQ product could be a way to cash in on any tech wreck over the coming weeks and months.
Want More Great Investing Ideas?
9 “MUST OWN” Growth Stocks for 2021
How to Ride the 2021 Stock Market Bubble
5 WINNING Stocks Chart Patterns
AAPL shares were trading at $126.03 per share on Tuesday afternoon, up $2.04 (+1.65%). Year-to-date, AAPL has declined -4.88%, versus a 6.15% rise in the benchmark S&P 500 index during the same period.
About the Author: Andrew Hecht

Andy spent nearly 35 years on Wall Street and is a sought-after commodity and futures trader, an options expert and analyst. In addition to working with StockNews, he is a top ranked author on Seeking Alpha. Learn more about Andy’s background, along with links to his most recent articles. More...
More Resources for the Stocks in this Article
| Ticker | POWR Rating | Industry Rank | Rank in Industry |
| AAPL | Get Rating | Get Rating | Get Rating |
| SQQQ | Get Rating | Get Rating | Get Rating |
| MSFT | Get Rating | Get Rating | Get Rating |
| AMZN | Get Rating | Get Rating | Get Rating |
| GOOGL | Get Rating | Get Rating | Get Rating |


