Earnings season officially kicks on Friday off with big banks such JP Morgan (JPM), Citigroup Inc.(C) and Wells Fargo (WFC), and then tech will start to join the parade with Netflix (NFLX) reporting after the close on Monday.
For some active traders, these jolts of information and the accompanying stock price movement, represent terrific short-term money-making opportunities. And many will try to juice the returns by using options.
Before getting to some of the concepts and strategies that can be employed in playing earnings reports, let me provide the caveat that all earnings plays are extremely speculative and should only involve a minimal allocation of risk capital. The challenge trading earnings is that there are many variables that need to be accounted for and correctly forecasted.
Not only must you determine if the company will meet estimates (and have those estimates recently been lowered or raised) and what kind of guidance will be provided., but also what has already been priced into the stock, has it recently run up or sold off. And most importantly, for our purpose, what percentage price movethat the options are pricing in at, as measured by their implied volatility
Prepare for a Post Earnings Premium Crush
This tendency for a Post Earnings Premium Crush (PEPC) makes understanding the relative “expensiveness” of options and the magnitude of the price move being priced in, crucial to improving the probability of achieving a profitable trade.
For a great visual, look at how Netflix’s historical volatility versus its implied volatility diverges then converges before and after earnings reports.
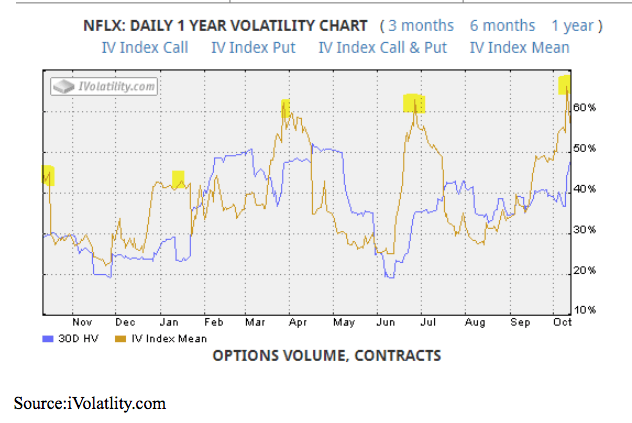
Netflix options usually ‘prices in’ a 10% price move. Meaning if you just buy options outright, whether it’s puts or calls, and the stock moves less than the expected 10% move, then you lose.
Expensive is Relative
On face value, Google’s (GOOGL), which reports April 29 options with an implied volatility of around 45%, appear “cheaper than Apples. But, when looked at relative to each stocks 30-day realized or historical volatility (HV), Google is actually more expensive. Google’s HV is 19%, meaning the options IV are running a near 90% premium compared to Apples HV, which is 22% — meaning its options are “only” a 45% premium. But again, monitor whether Apple’s options IV creep higher heading into earnings. A great free site for tracking options volatility, both historical and implied, is iVolatlity.com.
The reason most options see a decline in implied volatility following the report that it is wise to use a spread rather than the outright purchase of options in making a directional bet. The next step is using that implied volatility level to determine what size price move is being estimated or priced into the options.
This will help you determine which strike prices you might want to use in setting up your position. The down-and-dirty formula would be to simply take the price of the at-the-money straddle — that is, add the price of the puts and calls — and divide that total by the price of the underlying shares.
Given that most of the popular issues will have weekly options listed for their earnings reports, it would make sense that for those looking for the speculative action of earnings plays stick with the leverage of these short-term contracts. But, remember this leverage cuts both ways; if you are wrong, expect to lose 100% of your allocated capital.
I’ll drill down into some specific earnings options trades, which use PEPC in our favor, as the season plays out.
.
About the Author: Steve Smith

Steve has more than 30 years of investment experience with an expertise in options trading. He’s written for TheStreet.com, Minyanville and currently for Option Sensei. Learn more about Steve’s background, along with links to his most recent articles. More...
9 "Must Own" Growth Stocks For 2019
Get Free Updates
Join thousands of investors who get the latest news, insights and top rated picks from StockNews.com!
Top Stories on StockNews.com

Verizon (VZ) vs. T-Mobile (TMUS) Earnings Analysis - Which Telecom Stock Should Investors Buy?
With escalating consumer demand for high-speed data connectivity and technological advancements, the telecom industry is well-positioned for long-term growth. So, let’s analyze Verizon Communications (VZ) and T-Mobile (TMUS) to determine which of these telecom stocks investors should buy post-earnings release. Read more to find out...
Top 3 Auto Stocks to Buy and Hold for Long-Term Gains
Auto sales are projected to rise due to improved inventories, strong demand, robust consumer confidence, and technological advancements. Therefore, investors could consider buying and holding fundamentally strong auto stocks Stellantis (STLA), Bayerische Motoren Werke (BMWYY), and DENSO (DNZOY) for long-term gains. Read on...
3 Tech Stocks Offering Long-Term Investment Opportunities
In today's tech-driven world, businesses are digitizing their operations and adopting cutting-edge technologies, thereby driving the tech industry's growth. Against this backdrop, fundamentally strong tech stocks Motorola Solutions (MSI), Dolby Laboratories (DLB), and TaskUs (TASK) could be ideal long-term additions to one’s portfolio. Read more...
3 Energy Stocks Poised for Rapid Growth in May
Oil and gas prices have been surging lately due to an improving demand outlook and persistent supply risks amid geopolitical tensions, creating tailwinds for the energy sector. Thus, it could be wise to invest in fundamentally sound energy stocks Cenovus Energy (CVE), Weatherford International (WFRD), and Gulf Island Fabrication (GIFI) for rapid growth in May. Read on…