

A couple of days ago I wrote how the stock market was showing signs of euphoria and due for a correction. The options market has revealed just how frenetic the speculation had become and offers some indicators to keep an eye on.
Today we’re seeing the third consecutive down day for the “SPDR S&P 500 Trust (SPY - Get Rating)” and today’s doozy. Still, as of this writing, the SPY is only 6% from Monday’s high. This leaves it up a mere 30% from the March low.
So, is this the start of a larger ‘correction’, which is typically defined as a 10% decline, or will be short term breather followed by a quick snap-back?
First, it should be noted the past few days have been characterized by selling in the highly speculative stocks which had been bid up, often beyond any rational price or reason, and have been moving back to the former market leader, notably big cap tech.
For example, airlines and cruise ships such as “American Airlines (AAL)” and “Carnival Cruise (CCL) are down some 30% in just the past three trading days. The run-up in ‘trash’ such as bankrupt “Hertz (HTZ)” and “Chesapeake (CHK)” has crashed, down some 95% from their inexplicable 700% run ups.
Meanwhile, “Nasdaq 100 (QQQ - Get Rating)” hit a new high as people rushed back into “Microsoft (MSFT)” and “Apple (AAPL)” which went nearly parabolic yesterday. And today we see some favorites like “Shopify (SHOP)” was actually up as of midday.
Clearly there is still quite a bit of bullishness and residual buying as people might be viewing this decline —which brings us back to where we were just one week ago—suggests there is still a bit of froth that needs to be blown off.
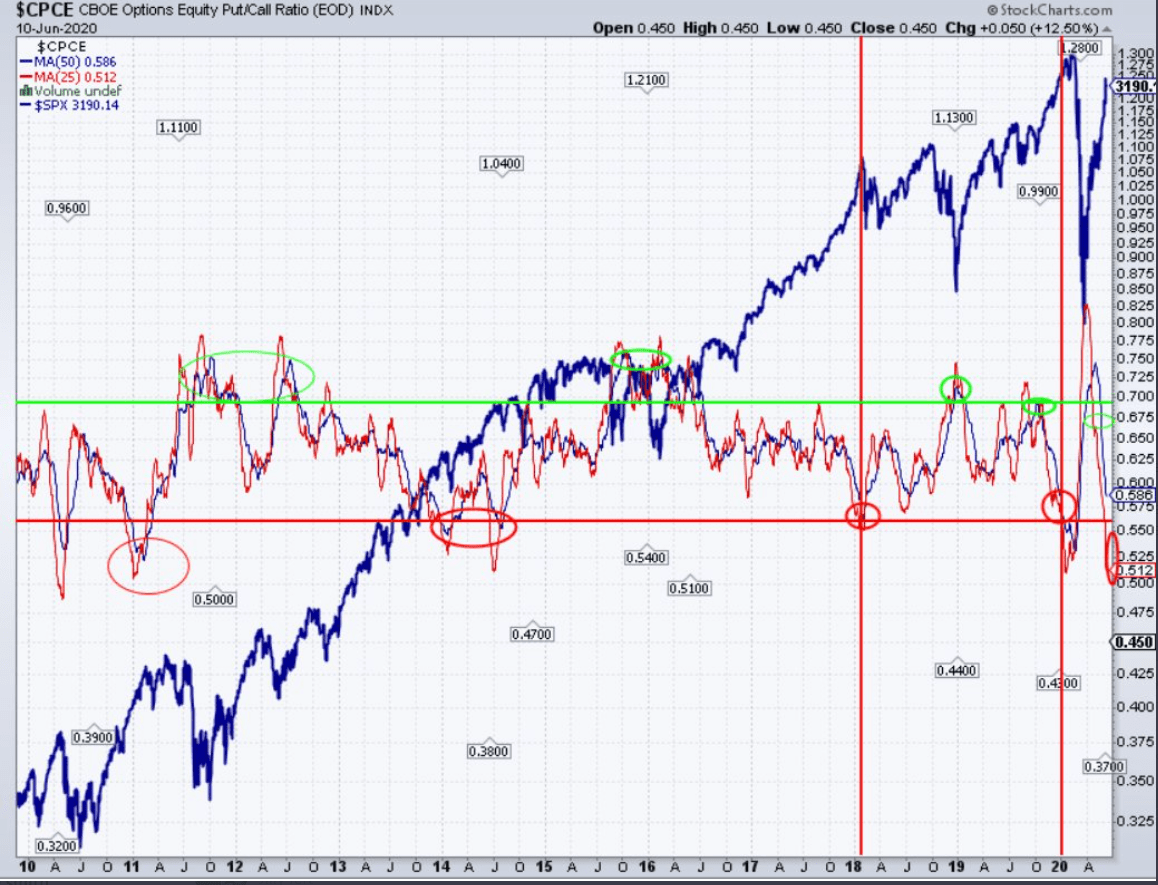
In prior pieces, I’ve pointed to the put/call ratio, which has dropped to near record lows and showed signs of complacency which usually coincided with short-term tops.
The action in the options market offers other indicators of the speculative frenzy.
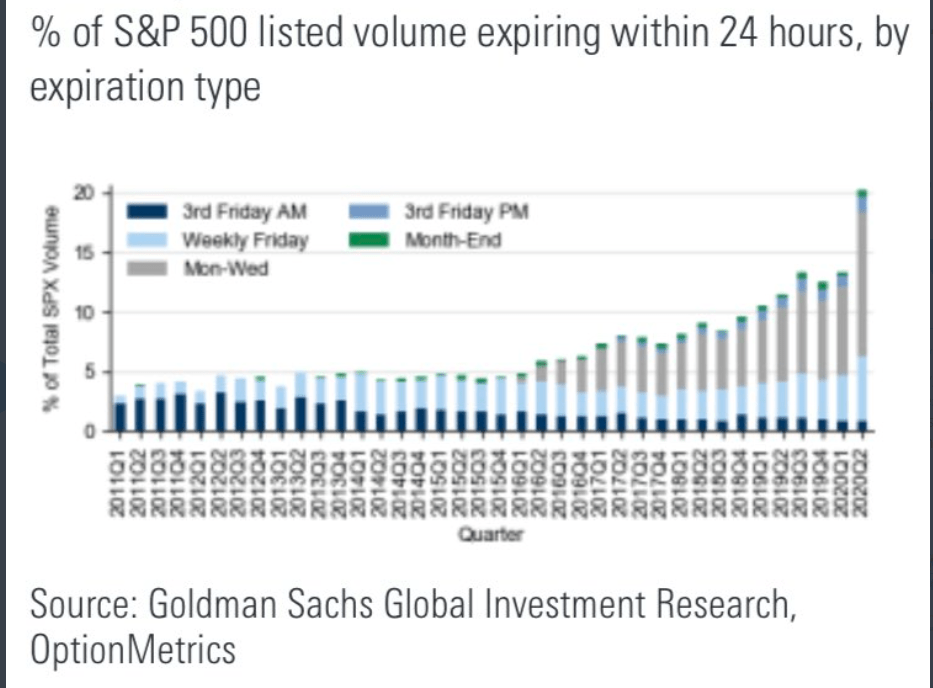
First, there has been a surge in trading S&P 500 futures and SPY options which have less than 48 hours until expiration. Remember, SPY has Monday and Wednesday expirations in addition to the weekly Friday.
Second, the skew in implied volatility has completing inverted.
By this I mean the normal structure is for put options to be more expensive than calls; this is due to investors and money managers typically are buying put for portfolio protection and selling calls to create covered calls.
But this reversed last week as people were reaching for calls and paying a premium to gain upside exposure on the belief the upside is unlimited.
“Tesla (TSLA - Get Rating)” provides a perfect example; on Wednesday when TSLA crossed $1000 per share the $900 puts that expire Friday was trading at $0.70 while the $1100 calls $6.00, or 8.5x more expensive.
Last time skew inverted to calls being more expensive than puts was during the dot.com bubble and even then, it never reached such an extreme reading. This tells me more pain needs to delivered before we reach a buyable level.
Want More Great Investing Ideas?
9 “BUY THE DIP” Growth Stocks for 2020
Bull Market or Bull S#*t? How to trade today’s stock bubble and prepare for the return of the bear market.
7 “Safe-Haven” Dividend Stocks for Turbulent Times
SPY shares were trading at $303.82 per share on Thursday afternoon, down $15.18 (-4.76%). Year-to-date, SPY has declined -5.05%, versus a % rise in the benchmark S&P 500 index during the same period.
About the Author: Option Sensei

Steve has more than 30 years of investment experience with an expertise in options trading. He’s written for TheStreet.com, Minyanville and currently for Option Sensei. Learn more about Steve’s background, along with links to his most recent articles. More...
More Resources for the Stocks in this Article
| Ticker | POWR Rating | Industry Rank | Rank in Industry |
| SPY | Get Rating | Get Rating | Get Rating |
| QQQ | Get Rating | Get Rating | Get Rating |
| TSLA | Get Rating | Get Rating | Get Rating |


