

I’m going to show you a dividend portfolio that gets you an incredible 9.5% payout—and you won’t have to take on stomach-churning risk (which, let’s face it, no one’s keen on doing now) to get it.
Imagine what a 9.5% dividend could mean. Take a $300,000 portfolio and you’ve suddenly got $2,375 in passive monthly income. A million bucks? You’re talking about almost $8,000 a month—miles ahead of the $1,500 a month you’d get if you just put it in an S&P 500 index fund.
Here’s the kicker: the investments in this five-fund portfolio, all closed-end funds (CEFs), invest in the same companies that make up the S&P 500.
CEFs: Your Ticket to “Sleep Well at Night” 7%+ Dividends
CEFs have been around for over a century, and they work a bit like a mutual fund or ETF, with two big exceptions.
One is that, as the name says, they’re closed, so when the fund issues shares for the first time, that’s pretty much it; new shares aren’t issued to new investors. Instead, you can only buy shares from previous investors.
This means your ownership of the assets within the fund is locked in; there’s no dilution, and there’s much less volatility than you get with some other high-yield assets, like business development companies (BDCs) or mortgage REITs. CEF prices tend to trend in a straighter line, with less volatility.
That’s not even the best part. This is: CEFs take conventional assets—think blue-chip stocks like Apple (AAPL - Get Rating) and Microsoft (MSFT - Get Rating)—and make them big yielders. They do this because fund managers are constantly buying and selling assets in their large (sometimes multi-billion-dollar) portfolios, and as one asset is sold for a profit, they can use some of those profits to buy something else and put money aside in the form of dividends to shareholders.
This strategy is sustainable. As I mentioned, some CEFs have been around for nearly a century, and many of the younger ones have seen their portfolios grow in recent years, pointing to a bright future.
5 CEFs Primed for Big Yields (and Upside)
Now let’s get into it—how can you use CEFs to build a diversified portfolio with big, sustainable dividends? Take a look at the table below.
| Symbol | Name | Asset Class | Yield on Price | Long-Term CAGR | NAV Minus Market Price, YTD |
| GAB | Gabelli Equity Trust | US Stocks | 12.0% | 12.2% | -0.9% |
| ASG | Liberty All-Star Growth | US Stocks | 7.3% | 15.6% | -2.3% |
| PTY | PIMCO Corporate & Income Opportunities | Corporate Bonds | 10.2% | 10.8% | 2.8% |
| JRS | Nuveen Real Estate Income | US Real Estate | 9.8% | 7.5% | 5.8% |
| GUT | Gabelli Utility Trust | Utilities | 8.0% | 9.1% | -15.7% |
These five CEFs come from different fund managers and have different strategies, so we get exposure to utilities, US stocks, real estate and corporate bonds. An equal investment in each of these funds gets us to that 9.5% average yield.
Put these together and you’ve got a great variety of high-quality assets. GAB looks for hidden value, so it holds stocks like Rollins (ROL - Get Rating), Mastercard (MA - Get Rating) and Honeywell (HON - Get Rating); ASG’s focus on big-cap growth gives you Amazon (AMZN - Get Rating), Microsoft (MSFT - Get Rating), Facebook (FB - Get Rating), Alphabet (GOOG - Get Rating), Autodesk (ADSK - Get Rating), Chegg (CHGG - Get Rating) and Illumina (ILMN - Get Rating).
Meanwhile, PTY will get you a variety of corporate bonds from S&P 500 companies and beyond; JRS makes you the landlord (without the work!) of hundreds of offices, apartment buildings and other properties around the country; and GUT gives you a piece of the utility companies people depend on—and will continue to, crisis or no.
Growing Your Wealth and Your Income
This portfolio does more than that, too. Because these funds are all top performers, averaging 11% annualized returns over the long term and either matching or beating their index, they’ll grow your investment to stratospheric heights.
A Few Years to a Million
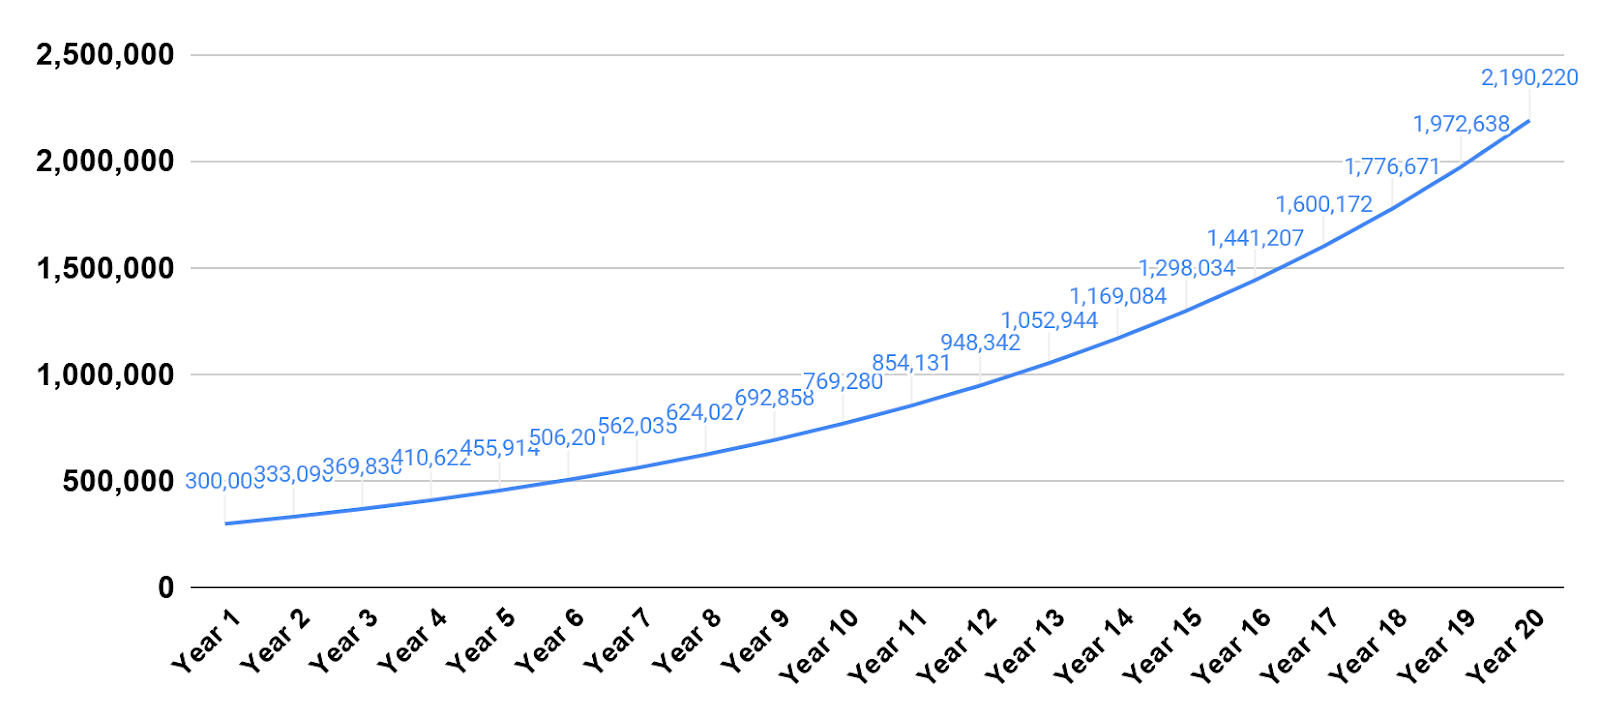
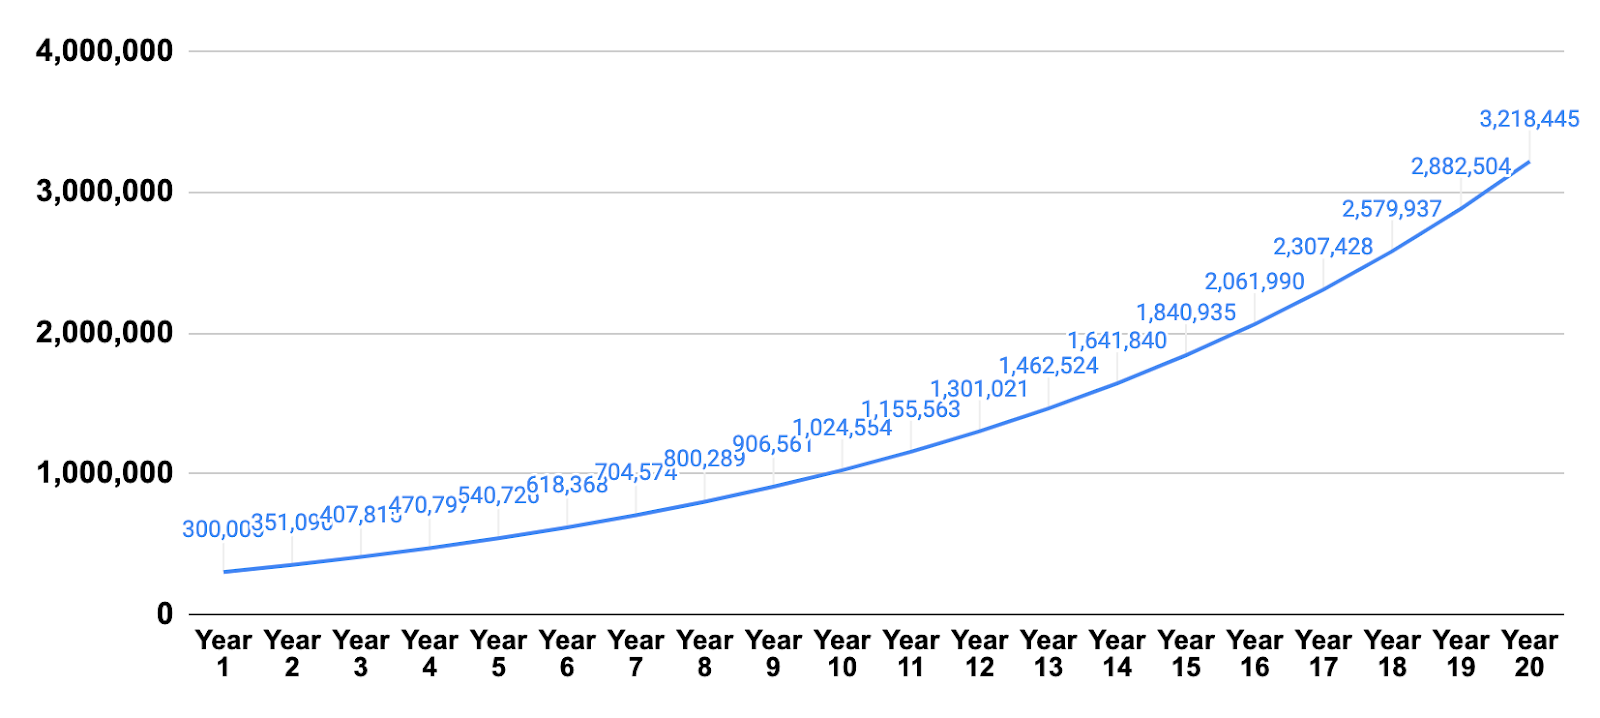
If you put just $300,000 in these funds and reinvest your dividends, you’d have a million dollars a little more than a decade later and over $2 million in 20 years. Throw an extra $1,500 per month into this portfolio over a 20-year timeframe and you’d have over $3 million while getting to seven figures even sooner.
Little Investment for a Big Reward
That’s a pretty small amount to put away in a short period of time! But at the end you’d have a portfolio that yields a whopping $25,479 per month.
Want More Great Investing Ideas?
Free Report: 5 Bargain Funds with Safe 11% Dividends
A “1-Click” Way to Grab Safe 8% Dividends
The $43,000 “dividend secret” Wall Street hides from you
ASG shares . Year-to-date, ASG has gained 9.54%, versus a 2.49% rise in the benchmark S&P 500 index during the same period.
About the Author: Michael Foster

Michael Foster has worked as an equity analyst for a decade, focusing on fundamental analysis of businesses and portfolio allocation strategies. His reports are widely read by analysts and portfolio managers at some of the largest hedge funds and investment banks in the world, with trillions of dollars in assets under management. More...


