StockNews.com
  • Login Join

StockNews.com
  • News
    • Top Stories
    • Video News
  • Best Stocks
    • "A" Rated Stocks
    • Upgrades/Downgrades
    • High Yield Dividend Stocks
    • Stock Screener
    • Top Stocks by Target Price
    • Dividend Discount Model Stock Valuation
    • Industry Rank
  • Best ETFs
    • "A" Rated ETFs
    • Best ETF Categories
    • High Yield ETFs
    • 7 Best ETFs
  • POWR Ratings
  • Upgrades/Downgrades
  • Watchlist
  • Screener
  • Services
    • Services Home
    • POWR Platinum
    • Reitmeister Total Return
    • Stocks Under $10
    • POWR Options
    • POWR Value
    • POWR Screens 10
    • POWR Income Insider
    • Premium
  • Login Join


  • Home
  • Articles posted by Stock News
  • (Page 2)
  • Uncategorized

2 Undervalued Growth Stocks You Should Buy During the Trade War

For months now the market has been wracked with worries over America’s escalating trade war with China. 12.5% tariffs are already in place on half of Chinese imports into the US and are set to double to 25% on January 1st. And with the Trump administration threatening to impose up to 25% tariffs on another $267 billion in Chinese imports (effectively all of them), the threat to global growth, as well as corporate profits, is severe.

But such periods of elevated risks are always opportunities in disguise. That’s because the market is always climbing a wall of worry over something, and today the trade war is just one brick (though the biggest one) in what stands between stocks and new record highs. And the good news is that we’re getting reports that a breakthrough that ends the trade war might be just days away. That means that today is potentially a great time to buy two especially trade sensitive dividend growth blue-chips, Apple (AAPL) and A.O Smith (AOS). These undervalued stocks are potentially coiled springs poised to rocket higher as soon as even a handshake deal is announced. And from today’s prices, that means market-beating total returns of 15% to 17% over the coming years.

Why The Trade War May Be Ending Relatively Soon

Friday and Saturday (November 30th and December 1st) is the G20 meeting in Buenos Aires, Argentina. The most important meeting between world leaders will be between President Trump and Chinese President Xi Jinping. That will be over a working dinner where both men will discuss the escalating trade war. Ahead of the meeting US and Chinese trade negotiators have been hammering out an outline for a working agreement to end the trade war once and for all. President Trump has indicated he’s looking to cut a deal and even ordered administration officials to draw up official paperwork that could allow him to end the tariffs in short order.

Now it’s important to note that analysts and trade experts are NOT expecting an official end to the entire trade conflict at this meeting. Rather we’re looking for a handshake deal like what Trump stuck with the EU that prevented over tariffs on over $300 billion in European imports (mostly to the US auto sector). The idea is that the two men can announce a “deal to make a future deal” that prevents 25% tariffs being imposed on all Chinese imports into the US.

Here, let me elaborate further…

Click on the Next Page to Continue Reading

None other than Larry Kudlow, Trump’s top economic advisor has expressed optimism about just such a deal saying on November 27th that, “There’s a good possibility we can make a deal…President Trump has indicated he is open – now we need to know if President Xi is open.” And on November 29th Trump said he was “close to doing something with China on trade.” Further good news is that Peter Navarro, the most hawkish trade warrior in the administration, will, according to Reuters, now be attending that Saturday working dinner meeting. Earlier he had said he would not causing some analysts to be skeptical that any major breakthrough could be reached. With Navarro now in the meeting, that means the dinner table will literally be set for the very handshake deal that Wall Street has been praying for.

While there remains a lot of uncertainty surround that Saturday dinner meeting, there is also cause for optimism. That stems from the fact that China’s economy has been slowing in recent years, hitting its slowest growth rate in a decade last quarter (and expected to keep slowing into next year). That wasn’t all from the trade war since thus far US tariffs on Chinese goods have largely been offset by the falling Chinese Yuan. Rather China’s been facing a contracting labor force since 2014 (due to its decades-long one-child policy, now revoked), and the government’s efforts to reduce economic growth dependence on debt.

However, the growth rate has now slowed to near the 6% limit the government considers dangerous for political stability, and thus Beijing has ordered state-owned banks to reverse course and deploy over $150 billion in extra lending as a form of stimulus. And keep in mind that the US threatened 25% tariffs on $200 billion in imports that go into effect January 1st means that China’s growth headwinds are only mounting. 25% tariffs on all Chinese imports to America would be an even bigger blow, and Trump has indicated that should no deal be struck soon, then he could announce the final $267 billion round of tariffs mid-December. The 90 day comment period means those would go into effect mid-February.

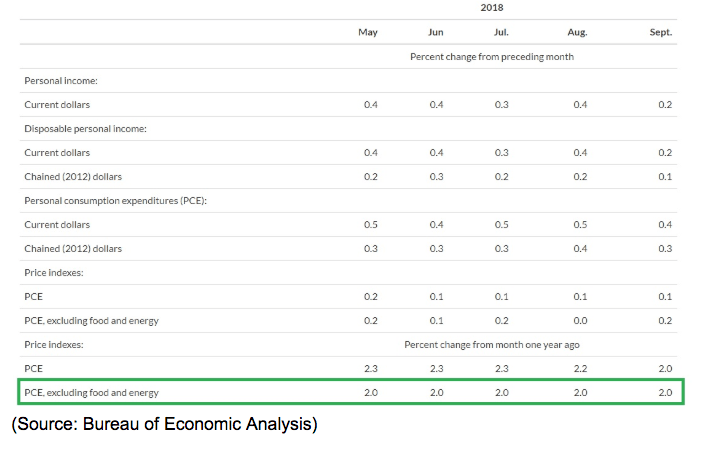
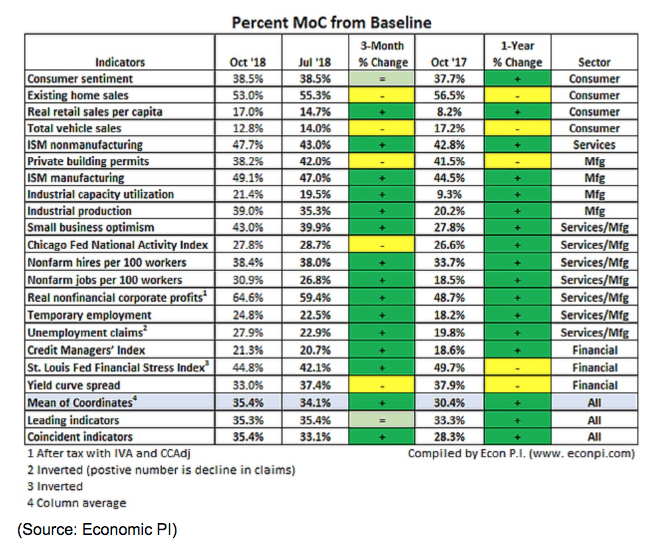
3What about the US perspective? Well, President Trump has certainly been aggressive in his stated belief that a “trade was is good and easy to win”. However, the reason that he’s been making more overtures to resolving the trade war is that the strong US economic growth he was expecting to let America ride out this conflict is now fast losing steam. In Q2 GDP grew 4.2% and 3.5% in Q3 (second estimate just released from the Burea of Economic Analysis). Q4’s growth estimates, based on leading economic indicators and economic reports have not been promising.

Here’s what I mean by that…

Click on the Next Page to Continue Reading

Atlanta Fed

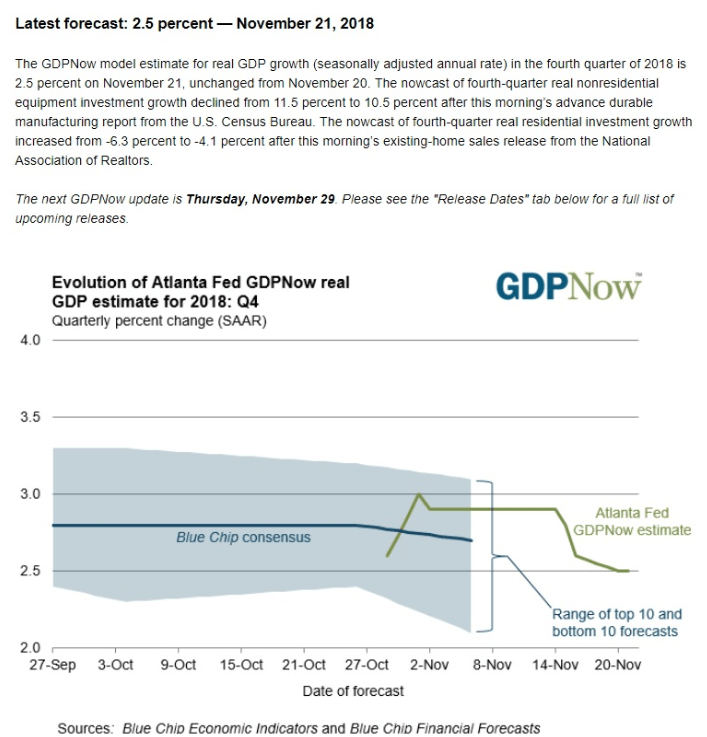
The current economist consensus is that America’s economy will grow just 2.6% this quarter, and the usually optimistic Atlanta Fed’s GDP now model say 2.5% growth is likely. That agrees with the New York Fed’s Nowcast which also calls for 2.5% growth.

Keep in mind that 2+% economic growth is still good, and not indicative of a coming recession. But the point is that 2018 was expected to be a very strong growth year for the US, with growth slowing to just 2.5% in 2019 and 2.0% in 2020 (due to fiscal stimulus wearing off). For growth to slow to 2.5% this early, and before US tariffs on Chinese imports are really even taking effect, is a worrying sign to economists, analysts, and administration officials. Goldman Sachs even believes that if the trade war continues all 2019 that US GDP growth will continue falling, hitting 1.6% in Q4 2019.

economic projections by fed

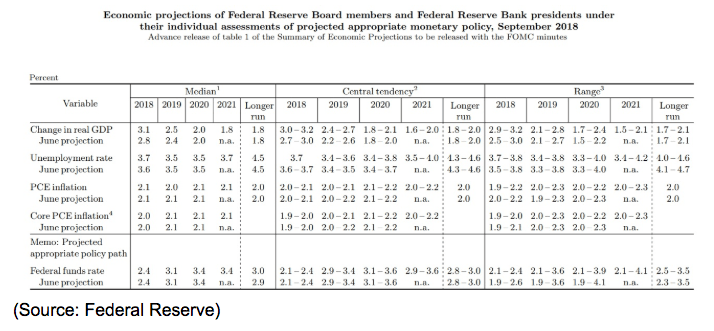
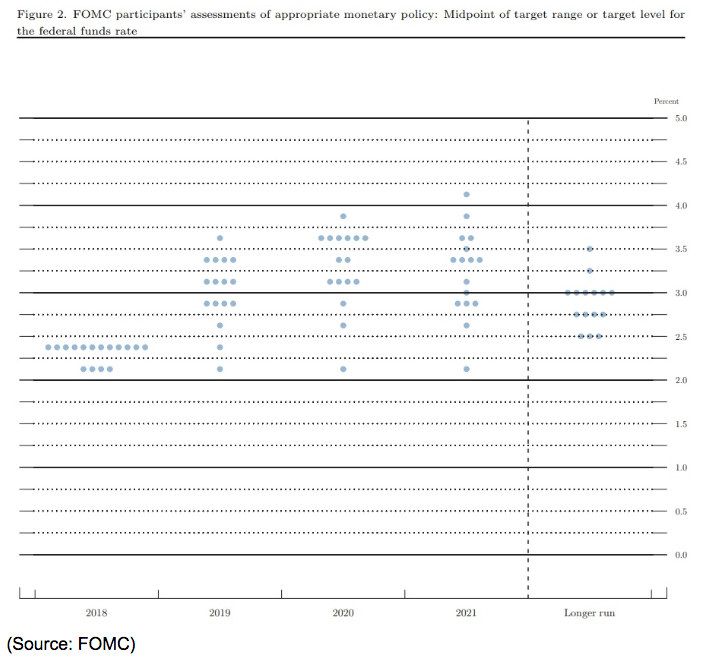
The Federal Reserve (and most economists) expect 2.5% GDP growth next year, 2.0% in 2020 and growth to finally bottom at 1.8% in 2021 and beyond. If the trade war reaches its maximum point (25% tariffs on all Chinese imports) and Goldman Sachs is right, then US growth could fall to levels significantly below even these highly conservative estimates, and two years ahead of expectation to boot.

Remember that President Trump is running for re-election in 2020 and his entire campaign strategy is to run on peace and prosperity that results from his promise to deliver “great deals” on trade and tax cuts. The tax cut stimulus is now over and done with, and so without a trade deal that removes the economic anchor that tariffs represent, his political life could be on the line if the US economy is growing under 2% in 2020.

Here are my thoughts on it…

Click on the Next Page to Continue Reading

No matter what you may think of Trump, or his difficult to follow political calculations, there is one thing I’m confident of. This is that he, like all politicians, are always looking to maximize their own political survival. The current global/US economic climate, in addition to the stock market’s recent correction (largely driven by trade war fears), is creating ever large pressure to cut a deal soon. No, a final resolution won’t be announced at the G20, but a handshake deal to prevent the worst effects of the trade war could. And even if such an agreement can’t be reached, simple economic realities mean that in early to mid-2019 at the latest, both the US and China are likely to be forced to end the tariff war. If only because not doing so would threaten the political futures of both Xi and Trump.

So, how can you profit from the potential end of the trade war in the coming weeks or months? By buying Apple and A.O Smith, two undervalued blue-chips poised to soar when such a deal is announced.

2 Great Undervalued Dividend Growth Stocks You’ll Want To Buy Before The Trade War Ends

Apple (AAPL)

Yield: 1.6%

Estimated Fair Value: $200

Discount To Fair Value: 10%

10 Year Analyst EPS/Dividend Growth Consensus: 13.1%

10 Year CAGR Total Return Potential: 15% to 16%

Apple’s plunge into a bear market actually had nothing to do with the trade war at all. That’s because while iPhones are assembled in China, thus far Tim Cook was able to negotiate a complete lack of tariffs on the US side. Similarly, China has not imposed retaliatory tariffs on iPhones, which is why Apple’s sales in that country continue to grow at double-digits.

So what makes Apple a potentially great trade sensitive coiled spring ahead of a potential trade deal? The fact that on November 26th President Trump specifically singled out Apple as an example of the kind of 10% to 25% tariffs that might be put in place in the coming months. That would mean that iPhones, whose average selling price is already at an all-time high, would become 10% to 25% more expensive for US consumers. Or alternatively, the company could just eat the tax and see its margins take a big hit. Bernstein’s Toni Sacconaghi estimates that 25% of Apple total revenues could be subject to the threatened tariffs, which could potentially result in a $1.5 billion to $3.8 billion hit to Apple’s profits. That equates to a 2% to 6% hit to the bottom line which would be significant given that next year analysts are expecting about 10% earnings growth from the company.

Worse is that if China did finally retaliate with tariffs on its own against Apple then the disruption to its supply chain might be even more damaging than the tariffs because they would affect products sold all over the world.

Here’s what it means for Apple…

Click on the Next Page to Continue Reading

So you can see that Apple stands to benefit immensely if the trade war ends, or merely even de-escalates. And keep in mind that the main reasons behind the recent price crash (speculation that iPhone XR was a flop) have been debunked by the company. On November 28th, Greg Joswiak, Apple’s VP of product marketing told Reuters,

“Since the iPhone XR became available, it’s been the best-selling iPhone each and every day that it’s been on sale.”

That bodes well for the company being able to achieve analysts long-term and realistic mid-single digit revenue growth and 13% EPS growth (driven by epic share buybacks from $123 billion in net cash and over $50 billion in annual post-dividend free cash flow).

And keep in mind that it’s not iPhone growth that’s going to be the main driver of that sales and earnings growth, but services.

service revenue per quarter

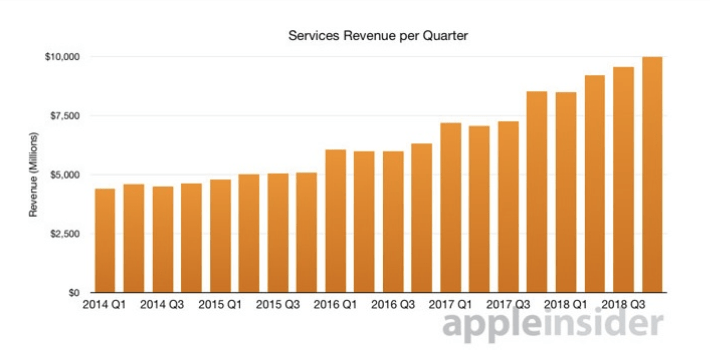
In 2017 Tim Cook stated the company’s goal was to hit $50 billion in annual service revenue (recurring subscription based and high margin) by 2020. Thanks to four years of about 30% annual growth service revenue are now at a $40 billion annual run rate putting the company well on track to crush that guidance.

apple paid subscriptions

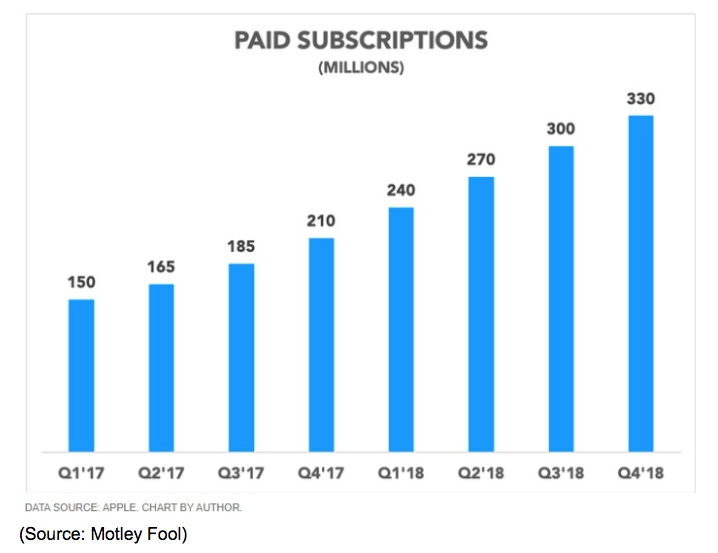
That’s thanks to Apple effectively monetizing its 1.3 billion iOS device user base and converting that in more monthly subscribers than there are people living in the US.

By 2023 Morgan Stanly’s Katy Huberty, who has accurately predicted service revenue growth for the last six straight quarters, estimates that Apple Music alone will have 164 million subscribers. And service revenue over the next five years is expected to nearly triple from $37 billion in 2018 to $101 billion. As a result, Morgan Stanley estimates Apple’s EPS will grow by 20% annually over the next five years. But even if you use just the current analyst consensus (13.1% growth rate) that still equates to Apple delivering 15% to 16% total returns, or roughly double what the S&P 500 is likely to deliver, in the coming years. That makes this low-risk dividend growth blue-chip a fantastic buy today, ahead of the potential end to the trade war.

Here’s another one to keep an eye on…

Click on the Next Page to Continue Reading

A.O Smith (AOS)

Yield: 1.9%

Estimated Fair Value: $79

Discount To Fair Value: 40%

10 Year Analyst EPS/Dividend Growth Consensus: 9.9%

10 Year CAGR Total Return Potential: 17%

A.O Smith is an industrial dividend aristocrat and thus its share price has been battered in recent months by both fears of a slowing economy as well as the trade war. That’s because of A.O Smith, a leading producer of water heaters and air/water purifiers, is extremely exposed to China.

china sales in us dollars

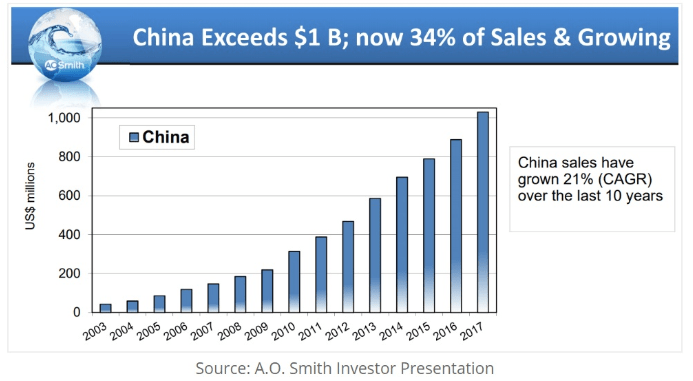
The company entered China’s market back in 2003 and has done a masterful job of establishing a 9,000 strong distributor network in 30% of China’s largest cities and 70% of its medium-sized cities. That’s fueled 21% sales growth which means that today over $1 billion or 34% of the company’s revenue comes from the middle kingdom.

But now with the trade war threatening its biggest growth market, (and slowing China’s economic growth), Wall Street is terrified that A.O Smith’s best growth days are behind it. But what the street is missing is that A.O Smith isn’t just the best way US dividend investors can profit from China’s growth, but India’s as well.

In fact, A.O Smith is my favorite dividend growth stock set to profit from the massive growth in both China’s and India’s middle class. A.O Smith set up its first office in India in 2008, began making and selling water heaters in 2010, and then water/air purifiers in 2015.

What does this mean for the markets?…

Click on the Next Page to Continue Reading

national retailers distribution

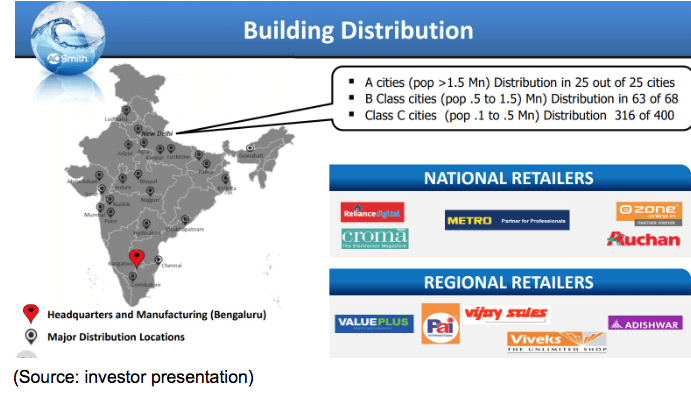
It’s fast building a leading network across that country’s largest cities, as well as smaller urban markets. That includes partnering with top national retailers, the Home Depot and Lowe’s of India. And given that India’s middle class is expected to reach 273 million households in 2020 and 322 million in 2030, A.O Smith has a massive growth runway ahead of it. In 2017 India sales (less than 1% of the company’s total) grew at 44%, signaling the company might be able to recreate its earlier Chinese success in that even larger potential market.

china india organic growth

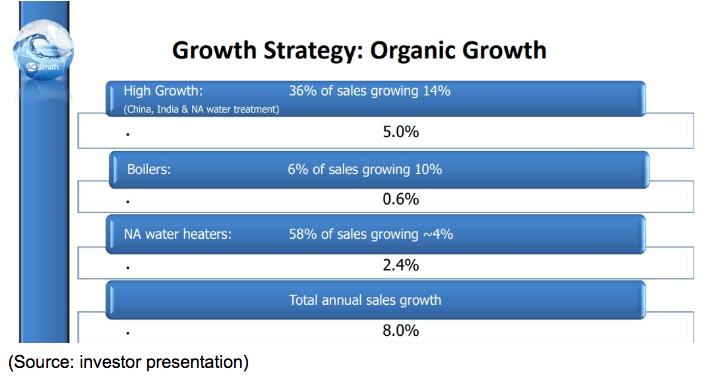
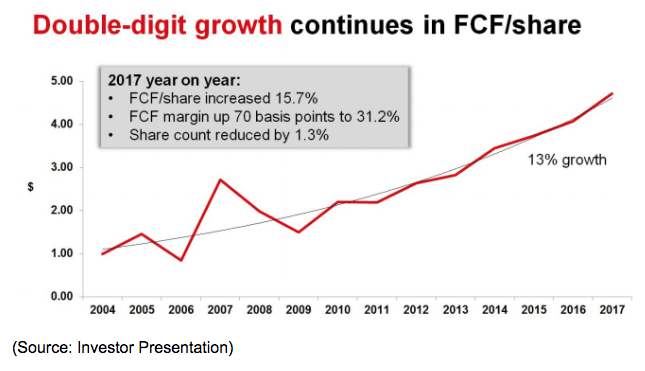
The combination of China and India is expected to help drive 8% long-term organic sales growth, which analysts expect to translate into 10% EPS growth over the long-term, even factoring in the current trade war (which will have to end eventually).

That doesn’t sound like much BUT when you factor in the company’s dividend and it’s current 40% discount to fair value you get the potential for 17% total returns over the coming decade. That’s more than double what the S&P 500 is likely to deliver, and from a low-risk dividend aristocrat (25 consecutive years of dividend growth) with a fortress-like balance sheet no less.

Bottom Line: Times Of High Market Volatility And Fear Are The Perfect Time To Buy Grade A Dividend Growth Stocks At Bargain Prices

While it’s far from guaranteed that we get a handshake agreement to end the trade war on Saturday, the fact is that both the US and Chinese economies are starting to feel the growing negative effects of escalating tariffs. Thus both Trump and Xi have strong incentives to at least announce a “deal to make a future deal” that prevents even further damage, such as 25% tariffs on another $267 billion in US imports from China next year.

If a deal is struck, either this week or soon after, then Apple and A.O Smith are poised to rocket higher, far off their recent bear market lows. And given the Grade A nature of both of these blue-chips, that makes today a great time for value-focused income growth investors to buy these coiled springs before they pop. And if a deal isn’t struck? Well then the low valuations of both stocks mean there is relatively little downside risk in the short-term, compared to the massive upside potential you can lock in by investing in both companies today.

  • 1
  • 2
  • 3
  • 4
  • 5
  • 6
  • 7
  • Home
  • Articles posted by Stock News
  • (Page 2)
  • Uncategorized

Is Now the Time to Invest in Airline Stocks? Find Out

Two years ago, Warren Buffet, who once swore he’d never again invest in airlines, gave the industry his blessing by investing some $10 billion in four of the major carriers. Since then, the stocks have had a bumpy ride. But now could be the time to get back on board.

Looking at the U.S. Global Jets Exchange Traded fund, one can see shares of airlines from late 2016, following the news of Buffet’s industry-wide investment.

They had an uneven performance — eventually peaking in early 2018 with a 25% year-over-year gain before tumbling this fall, now staging a small recovery.

us global jets etf chart

 I think several factors are in place for the shares to continue climbing and hit new highs in the coming months.

  • The recent drop in oil prices have substantially reduced the cost of jet fuel, which after labor, is the second largest operating cost.  Airlines should be able to use futures to lock in these low prices, at least for a large portion of their need, for the next 12 months.
  • Airlines are beginning to show they have pricing power;  recent reports from both Spirit Airlines (SAVE) and Southwest (LUV) show that price increases are sticking.
  • This comes just as we head into the busy holiday travel season.  AAA reported a record number of people that (53.5 million) traveled over 50 miles this past Thanksgiving — with over 5 million of those by air, a record 5% year-over-year increase.

As far as Christmas goes… Continue reading on the Next Page

Christmas is expected to also see record numbers with even more air travel, as winter break people being the most likely ones to take vacations rather than visit family, which tends to be more local.

The bottom line is key fundamental factors such as lower costs, higher fares, reduced union and pension expense — and no meaningful increase in capacity — should lead to highly profitable quarter and nice rally in their stock price.

My two top picks are JetBlue (JBLU) and Southwest (LUV) as they are focused on the U.S. and Caribbean markets with good market share on some of the most profitable routes.  It also means less exposure to the global market, which has seen less overseas travel amid slowing global growth.  


  • 1
  • 2
  • Home
  • Articles posted by Stock News
  • (Page 2)
  • Uncategorized

2 Undervalued Dividend Blue-Chip Stocks

On Black Friday the S&P 500 officially entered its second correction of the year. One of the big reasons for the sharp market drop was worries that the Federal Reserve is heck bent on hiking rates to dangerous levels that could trigger a recession and bear market.

Let’s take a look at what exactly investors are so scared of, but more importantly why those fears are likely to prove overblown. Which means that today is a great time to consider adding BlackRock (BLK) and Texas Instruments (TXN) to your portfolio. These two deeply undervalued blue-chip dividend growth stocks are likely to generate 18% to 19% CAGR total returns over the coming years, making them excellent opportunistic additions to any income growth portfolio during this correction.

Why Investors Are Scared Of Fed Rate Hikes…

The big fear that investors have is that the Fed, afraid of the hottest job market in 20 years (with the lowest unemployment in half a century), will feel the need to hike rates five or even six times.

Federal funds rate

That’s based on the Fed’s latest dot plot, which shows the estimates of where the Federal Fund Rate will end up in the future.

The Federal Funds Rate affects consumer borrowing costs (Bank Prime lending rates are indexed to it), and it also tends to be closely correlated with short-term treasury yields (like the 1 and 2-year bond yields).

Federal funds rate

But since long-term rates (like the 10-year yield) are not driven by the FFR, but long-term inflation expectations, this means that if the Fed hikes too quickly and too much, then short-term yields can rise higher than long-term ones. That’s called an inverted yield curve and since 1955 90% of the time, the 2/10 yield curve has inverted a recession has followed six to 24 months later (17-month average).

This makes the bond market in general, and the yield curve, in particular, the best recession predictor ever discovered. Why does an inverted curve predict recessions so well? Because according to the Fed’s most recent survey of banking loan officers:

“Banks would tighten standards or price terms across every major loan category if the yield curve were to invert, a scenario that they interpreted as a signal of a deterioration in economic conditions.”

Basically, the yield curve might be a self-fulfilling prophecy. If it inverts then banks fear a recession is coming, and thus start cutting off credit to the economy, and thus cause the very recession they feared was imminent.

The 2/10 yield curve is currently at 0.23%, near its August 2018 lows (0.18%). Analysts at Goldman Sachs and JPMorgan Chase expect the curve could invert by mid-2019 if the Fed makes good on its current plan to hike again in December, and then in March, June, and December of 2019 (Goldman thinks it will also hike in September).

And while it’s true that four or five more rate hikes would almost certainly invert the yield curve and start the recession clock ticking, there are also very good reasons that investors shouldn’t expect the Fed to hike nearly that much.

…And Why They Shouldn’t Be

The bond futures market is currently pricing in just three more rate hikes and then expects the Fed to end its current rate hike cycle.

Fed funds actual and future expectations

That’s because a Fed Funds Rate of 3.0% is the Fed’s best estimate of the “neutral rate,” or the rate at which point it is neither slowing or accelerating economic growth. An FFR of 3% coincides with three more rate hikes, not the five or six the dot plot is currently signaling.

Why is the bond market expecting the Fed to end its rate hikes early? Well for three reasons. First, the Fed’s goal with rate hikes is purely to avoid allowing core inflation (which it officially measures by core PCE), to rise above its long-term target of 2.0%.

PCE Chart

Core inflation has been stable at the Fed’s long-term target all year. The October core PCE is coming out on Thursday, November 30th.

But won’t rising wages (from the tight job market) and tariffs cause inflation to increase in the future? Not according to the bond market’s long-term inflation expectations, which are currently running at just under 2.0% for the next decade and have actually been falling gradually over the last few months.

Indicator snapshot

Inflation expectations are declining because US economic growth was expected to slow in 2019 and 2020. That’s precisely what’s happening, with leading economic indicators now pointing to steady but slower 2.6% growth in Q4 2018, and likely 2.5% growth in 2019 (2.0% expected in 2020).

Slower economic growth not just means less risk of inflation rising above the Fed’s target, but also now has the Fed worried above the economy. On November 14th Fed Chairman Jerome Powell said the following at a meeting at the Dallas Fed:

“So, you know, a good example is — a noneconomic example would be you’re walking through a room full of furniture and the lights go off. What do you do? You slow down. You stop, probably, and feel your way.” – Fed Chairman Jerome Powell

Specifically, Powell was talking about growing risks to the US economy, including the trade war, the fading of fiscal stimulus (tax cuts and increased government spending) in 2019 and beyond and the delayed effect of previous rate hikes (there have been eight so far).

On November 16th the Fed’s Vice Chairman Richard Clarida told CNBC  “As you move into the range of policy that, by some estimates is close to neutral…it is appropriate to sort of shift the emphasis towards being more data-dependent. I think Chair Powell the other day made the analogy … if you’re in a dark room, especially without your shoes on, you want to go slow so you don’t stub your toe. So I think data dependence makes sense right here.”

Basically, the Fed’s top two officials are saying that once the neutral rate is reached (what short-term yields have already priced in) then the Fed won’t hike unless the economic data says it should (because inflation is above target or the economy is growing faster than expected and threatening to overheat).

Given the current macroeconomic situation (which I track closely in my weekly economic updates) the chances are good that the Fed will prove the bond market right, and halt its rate hikes in June of 2019. What that would signal for the US economy is:

  • Slower but steady growth
  • Stable and low inflation
  • Continued historically low interest rates
  • Possibly no yield curve inversion in 2019 (or even 2020)
  • No recession likely to begin until 2021 (or even 2022 or 2023)
  • No bear market beginning before mid-2020 at the earliest (but likely 2021 or later)

All of which means that this latest correction is likely not the start of a bear market (82% of which occur during recessions) but the natural 10% to 19.9% declines the market undergoes on average every 2.9 years since 1965.

S&P 500 Corrections

Including 2018’s two corrections, the average correction sees stocks bottom after three months, at 12.3% from their all-time highs, and then take four months to hit record highs again. The last correction ended in a 10.2% peak drawdown and so far this one has seen an identical 10.2% peak decline.

That means we’re likely near the bottom of the market, which makes it the perfect time to go bargain hunting for deeply undervalued, fast-growing dividend blue-chips.

Why You Should Buy These 2 Deeply Undervalued Blue-Chips Today

I generally use dividend yield theory or DYT to determine valuations for blue-chip dividend stocks. That’s because since 1966 this method has been exclusive what asset manager/newsletter publisher Investment Quality Trends has used to deliver decades of market-beating returns with 10% lower volatility.

IQT model

For an in-depth explanation of how to use dividend yield theory, see the introduction to the watchlist section of my weekly portfolio updates.

Texas Instruments (TXN)

Yield: 3.2%

Fair Value Yield: 2.5%

Discount To Fair Value: 22%

Long-Term EPS/FCF Growth (Analyst Consensus): 12.6%

Valuation Adjusted Total Return Potential (Next 10 Years): 18%

Right now Texas Instruments is in a bear market due to two main fears. One is the trade war with China, which could hurt its overseas sales in the short-term. The other is that the semiconductor industry is naturally cyclical and right now the industry is likely facing a weaker 2019 (down cycle). But here’s what the market is missing.

FCF Share

Texas Instruments, while suffering periods of cash flow volatility, has an excellent track record of delivering strong, double-digit free cash flow or FCF/share growth over time. FCF is what’s left over after running the company and investing in future growth. It’s what funds the dividend which has grown at 27% CAGR (36 fold) over the past 15 years.

Analysts are currently expecting the company to deliver 12.6% long-term EPS/FCF growth thanks to two factors. First is the company’s strong growth in high margin industrial and automotive chips. 5G will bring with it greater growth in the internet of things and driverless cars which gives the company a massive and long growth runway. The company is legendary at focused and highly effective R&D. That’s what has allowed the company to build up a portfolio of 45,000 patents, and why it enjoys 36% FCF margins (higher than 87% of S&P 500 companies).

TXN is an FCF minting machine and has a policy of returning 100% of FCF to shareholders via buybacks and fast-growing dividends. Remember that FCF is what’s left over after funding R&D and growth capex, so this is both a sustainable and very shareholder friendly policy.

Texas Instruments yield has ranged from 0.9% to 3.5% and in March 2009 hit a peak of 3.2% when the market feared another global depression was imminent. Today’s yield of 3.2% is still a great time to add this wide-moat industry leader to your portfolio, as I did during the current correction. That’s because at current valuations Texas Instruments has very little potential downside, but massive upside (423% returns over the next decade).

BlackRock (BLK)

Yield: 3.1%

Fair Value Yield: 2.5%

Discount To Fair Value: 19%

Long-Term EPS/FCF Growth (Analyst Consensus): 13.7%

Valuation Adjusted Total Return Potential: 19%

BlackRock has fallen into a bear market along with other asset managers over fears that the rise of ever lower cost passive index funds will drive a race to the bottom that will gut the industry’s profitability. But the world’s largest asset manager ($6.44 trillion in assets under management) has precisely the kind of scale and vast financial resources to not just survive the continued growth of passive investing, but thrive in it, and continue delivering great long-term returns.

Thanks to the popularity of iShares, BlackRock commands 40% global passive ETF market share. It’s grown its AUM by 4.5% annually over the past five years, compared to just 0.7% for its 12 largest peers.

ETF Growth Outlook

ETF AUM is expected to grow 10% to 20% annually over the next five years, and BlackRock has proven that its deep industry connections (with financial advisors and institutional money managers) mean that much of that industry growth will accrue to it. That’s courtesy of superior risk-management and data analysis software in its Aladdin platform.

This is an artificial intelligence-driven software platform that over 25,000 global fund managers already use and find essential. For example, according to Anthony Malloy, CEO of New York Life Investors ($238 billion AUM), “Aladdin is like oxygen. Without it, we wouldn’t be able to function”.

This lead in advanced risk-management technology is why, despite Fidelity launching zero expense ratio ETFs in recent months, iShares has actually seen the strongest asset inflows in five years. And the company continues to win major contracts with pension funds around the world, who are happy to pay its above-average fees (0.26% expense ratio) in exchange for working with the most trusted name in the industry and which can provide the best risk-management solutions.

Today BlackRock’s yield is near the upper end of its historical range (1.2% to 3.5%) meaning that the 19% undervalued shares represent a great opportunity to buy the Amazon of asset managers and lock in about 19% long-term total returns. That equates to nearly 500% total returns over the next decade and make BlackRock one of the best dividend growth blue-chips you can buy today.

Bottom Line: Stocks Are Always Climbing A Wall Of Worry So Take Advantage Of Market Fears To Buy Quality Undervalued Dividend Blue Chips

Stocks are a risk asset, and thus prone to periods of strong negative volatility. But it’s important to remember that the market has generated its excellent historical returns not despite corrections, but precisely because of them. Periods of strong market fear are the perfect time to buy deeply undervalued quality dividend stocks.

Today the market’s overblown worries about Fed rate hikes (which are likely to stop soon) make BlackRock and Texas Instruments are two of my favorite recommendations. That’s owing to their wide moats, excellent management, and great long-term dividend growth prospects. Combined with the most attractive valuations in years, that means both should deliver not just safe and fast-rising dividends in the future, but market market-crushing 18% to 19% CAGR total returns as well.

  • 1
  • 2
  • 3
  • 4
  • 5
  • 6
  • 7
  • 8
  • Home
  • Articles posted by Stock News
  • (Page 2)
  • Uncategorized

3 Signals that the Market Sell-Off Is Coming to an End

The charts of all the major indices and most individual stocks look terrible. But we are getting some initial signals that the selling is abating.  Here’s what to look for.

It’s doubtful the market will be able to have a sustainable move higher until concerns about a hawkish Fed and the trade war with China get resolved.  The lack of clarity on those two issues has caused a major shift in investor sentiment where even good news such as strong earnings is being met with selling.  And the recent and rapid declines in FAANG names has been a big blow to market psychology.

At some point, the negativity will exceed what’s warranted and valuations will have already come down enough to discount bad news. We are already seeing hints of this in price action.

As discussed, many stocks — whole sectors of the market — have already dropped by 20%, putting them in a bear market.  Here, we find the first glimmer of hope that the worst could be over. During the past week, we’ve seen sectors such as housing, industrials, and biotechnology have actually moved higher.  These were some of the first and hardest hit stocks and the fact that they are now finding some support suggests the selling is abating.

Housing has rallied some 5% over the past week despite weak housing data.

ITB Shares US Home Construction

Industrials did not make a new low despite heavyweights, such as Boeing sliding and concerns over slowing global growth.

XBI SPDR Chart

The rotational buying in the most beaten down sectors also helped improve the overall market breadth and the number of issues making new 52-week lows contracted; both are positive signs.

If some of these internal measures continue to improve and more stocks stop selling off on bad news, it would be a strong sign the stock market is nearing an intermediate-term low

There’s a saying, and belief, that markets can correct through both time and price. The current market decline began some seven weeks or 48 days ago.  The average length of the last 20 corrections was 45 days. Meaning, it would seem the market has now satisfied both time and price components that would allow for a bottom to be built.

While charts and price action are still troubling, there are some good initial signals that the worst could shift positively by the end of the year.

  • Home
  • Articles posted by Stock News
  • (Page 2)
  • Uncategorized

Bitcoin Comes Home for the Holidays [Details]

Everyone was worried about how politics might ruin the Thanksgiving meal this year.  But it was the Bitcoin bubble coming home to roost that created caustic misgivings.

There used to be a saying “don’t trust anyone under 30.”  I’m sure this was flipped on its head around the Thanksgiving table as Aunts, Uncles, and grandparents railed against their sparkly-eyed younger relatives who had managed to convince them to buy into Bitcoin a year ago today.

In the days following last year’s Thanksgiving dinner, Coinbase, the lead U.S. based crypto-exchange saw a four-fold surge in the account openings — adding over 300,000 accounts.

The buying frenzy was on. By Monday morning, the price of BTC had surged by 25% to near $10,000.  And it was just getting going. It quickly surged another 60% before a brief dip prior to Christmas.  Hurry grandma, this a golden buying opportunity!

Account opening and price of BTC surged again with both peaking just after the New Year. Now, with Bitcoin price back below $5,000 many people are left with a hangover.

BTCUSD Chart

And it wasn’t just Bitcoin that took from people’s homes and wallets; there was a massive increase in the issuance of new cryptocurrencies and Initial Coin Offerings (ICO), which gathered some $1 billion assets.

The number of crypto “hedge funds” launched also more than doubled last January meaning a good deal of money was buying in at the top.

2018 Crypto Fund

This helped push coins of all stripes, from Ripple to Porncoin, 500% to 1000% gains in a matter of months. Now, they are all well below, not only their peak, but from their year-ago level.  Many are completely worthless.

This not only made for uncomfortable Thanksgiving conversation but has ravaged some supposedly sophisticated hedge funds and tarnished some respected analysts reputations.

Keep this in mind when some young whippersnapper with a HODL attitude  tells you that the current price is a buying opportunity.  They’ve been saying it at every level down for the past six months.

Google Search

Like another old saying goes, “there’s a sucker born every minute.”

Enjoy your holiday.

  • 1
  • 2
  • Home
  • Articles posted by Stock News
  • (Page 2)
  • Uncategorized

Will Current Market Correction Turn into a Bear Market?

Over the past six weeks, the broad stock indices — such as the S&P 500 and Nasdaq 100 — have given up their year-to-date gains, and are now off about 10% from their 52-week, putting them in ‘correction’ territory.  Will it turn into a bear market?

While the technical definition of a stock market correction is considered a 10%, and bear market is a 20%, one could make the case that the U.S. has not only experienced the former, but are already teetering on the latter.

The fact is that over 300 of the S&P 500 stocks have been down by 20% or more over the past six months. The only thing keeping the indices up has been a rotation from one sector. Essentially, we’ve had a rolling bear market beneath the surface as selling moved from housing to semiconductor to energy to industrials to retail and most recently, the large cap FAANG.

In the global context, we can consider the U.S markets recent decline as a similar “retreat of the general.”

In prior articles, we’ve highlighted the year-long weakness in stocks around the world and wondered whether they would play catch up to the U.S.  Over the past few quarters, we started to get a sense that something was wrong.

We did not see the rotation come in like we had seen so consistently after any sector went through a period of underperformance. Rotation is the lifeblood of a bull market. Money did not flow back into foreign markets, and as it turns out, the U.S. was truly the last man standing. 

Baird Research Chart

What other clues were out there that might have warned of the U.S. playing “catch up to the downside” rather than the rest of the world joining the bull market party?

Germany, the most important economy in Europe, has been a great leading indicator in the past. We often see Germany rolling over prior to U.S. markets getting hit.

German DAX

Here is a good example from the 2015 top: Germany peaked and started rolling over well in advance of the U.S., suggesting that there is more downside ahead.

S&P500 German DAX

Source: Optuma/Allstarcharts

The upshot is that the tone of the stock market has changed, and investors should adjust their game plan accordingly.

And it is the first time since 2002 that buying the dip on a week-to-week basis has resulted in a negative return.

Average Daily SPX Return

The only group of late that has enjoyed some relative strength has been consumer staples, which are being viewed as a safe haven. This can no longer be viewed as healthy rotation. This seems like hiding in this bear’s den hoping not to be eaten.  Not wise.


  • 1
  • 2
  • 3
  • Home
  • Articles posted by Stock News
  • (Page 2)
  • Uncategorized

Here’s Why Stocks Are Plunging & What You Can Do to Protect Your Portfolio

October was the worst month for the S&P 500 in seven years, while the Nasdaq suffered its biggest monthly decline since November of 2008. However, now it appears that “Red October” might not have been the bottom after all. November has once more seen stocks sliding fast and hard, this time being led by tech blue-chips which for years were the darlings of Wall Street.  

Investors naturally want to know whether or not this retracement to our previous October lows is a sign that a bear market is indeed underway, possibly signaling an impending economic recession that could wreak havoc on corporate earnings and thus their portfolios.

Here are the main reasons stocks are falling so fast right now, and more importantly, what you can do to protect your portfolio.

Why Stocks Are Plunging

At a technical level, the market is now being driven lower by the way that stock indexes are weighted. For example, the S&P 500 is a market cap weighted index in which the larger the company the more important it is in the index (and thus the bigger the effect on the market’s headline figure).

                                    S&P 500 Top 10 Holdings

top stocks holdings

Tech, in general, makes up 23% of the S&P 500, thanks to nearly a decade of tech stocks storming higher on the back of very strong earnings growth (and arguably investor overexuberance). Meanwhile, Apple, Microsoft, Amazon, Facebook, and Alphabet alone make up just over 14% of the entire index.

This quarter all these tech names reported good top and bottom line growth but with the exception of Microsoft, disappointed on Q4 guidance. In today’s fearful “risk off” environment, investors are hyper-focused on what might go wrong with these company’s strong fundamentals.

Add to that the fact that tech stocks are sensitive to economic growth, both domestic and global, and you have yet another reason for tech stocks plunging into a bear market, and dragging the entire market down with it.

Yield Curve Regime

According to BlackRock, since 1995 tech stocks have been the best performing sector as long as the economy was growing (bear steepening and bear flattening yield curve regimes). However, during a recession (or right before it, a bull steepening regime) tech stocks are the second-worst performing sector.

In addition to general fears of an impending recession (concerns of an overzealous Fed hiking short-term rates too high) and you can understand why investors are nervous. And of course, we can’t forget about the ongoing trade war, which threatens to both slow the US and global growth and hurt corporate earnings.

geographic revenue exposure

(Source: FactSet Research)

S&P 500 Aggregate Sector Geographic Revenue Exposure

That’s because 39% of S&P 500 revenues come from overseas, with tech stocks being the most vulnerable of all to disruption from a trade war with China. Last week the US announced it was resuming trade talks with Beijing after China sent a revised list of terms that would resolve many of America’s biggest issues with the trade between our two nations.

Most importantly, the market cheered when the three positive trade-related news stories broke. First Trump tweeted that China was eager to make a deal, and he was as well (he ordered administration officials to draw up the paperwork). More importantly, US Trade Rep Lighthizer told reporters that lower level negotiators were being empowered to build a framework that Trump and Chinese Premier Xi could discuss at the G20 Summit in Argentina on Nov 30th/December 1st. Most promising of all was Lighthizer saying that the $267 billion round of tariffs (which would have placed tariffs on 100% of Chinese imports) was on hold while talks were underway.

But over the weekend Vice President Mike Pence spoiled the festive trade mood by giving a fiery speech in which he warned the US/China trade war would not end until China capitulated to US demands, specifically regarding both intellectual property protections and drastically reducing the China/US trade deficit.

Meanwhile, US economic growth forecasts for Q4 2018 have been coming in much slower than the last two quarters (2.7% compared to 4.2% in Q2 and 3.5% in Q3), which has the market worried that next year the US might be facing much slower growth or even a recession.

On top of that analyst earnings forecasts for 2019 earnings growth are rapidly declining, from a high of 10.4% a few weeks ago, to just 9.0% today.

2018 earnings growth estimate

Add it all up and you have the makings for a “risk off” scenario in which even objectively good fundamentals are ignored in favor of worrying about what might happen next year. So how can investors protect themselves from the bears currently running wild on Wall Street?

How To Protect Your Portfolio When Wall Street Runs Deep Red

History is very clear that the best way for you to lose money is to panic sell during times like these. Thus to help you stay calm and avoid making a potentially costly mistake, here are three things to remember about Wall Street’s current fears.

First, the US economy is NOT likely headed for recession anytime soon. That’s based on my weekly tracking of no less than seven leading meta-analyses of leading economic indicators and economic models in my weekly economic updates.

Percent MoC from baseline

The most important one is the 19 leading economic indicators which have historically proven to trend downwards long before the US enters a recession. Today 16 of those indicators are signaling continued growth and the trend in most of them, both short-term (three months) and long-term (one year) is firmly positive. Yes, the economy is slowing, possibly due to the trade war. BUT the fundamental health of the economy, indicated by so many positive leading indicators, shows that a recession isn’t likely to be followed by the slower growth that most economists (and the Fed) expected to happen next year. In other words, slowing growth in Q4 is NOT a surprise and is precisely what we expected to happen.

Further evidence that a recession isn’t coming soon (most likely late 2020 or early 2021 at the earliest), comes from the bond market, which has been the most accurate recession predictor yet discovered. The bond market is driven by large institutional money flows, from things like asset managers, pension funds, insurance companies, and sovereign wealth funds. These are the people whose job it is to keep a pulse on the US and global economy and protect billions of people’s money during such downturns.

The way the bond market warns us about recessions is via the yield curve, which is the difference between short and long-term bond yields. When short-term yields exceed long-term ones, the curve is said to be inverted. According to a study by the San Francisco Federal Reserve an inverted yield curve has “correctly signaled all nine recessions since 1955 and had only one false positive, in the mid-1960s, when an inversion was followed by an economic slowdown but not an official recession.”

Specifically, when the 2-year and 10-year yield curve inverts, 90% of the time within six to 24 months a recession begins (average lead time 17 months). The 2/10 yield curve has indeed been falling (flattening) for years now. BUT in the last few weeks, despite falling long-term yields (flight to safety) the curve has actually remained stable.

federal reserve maturity

In fact, the 2/10 yield curve (there are actually dozens of yield curves), bottomed on August 18th at 0.18% and has since recovered to 0.27%. More importantly, in recent weeks, it’s actually been stable, despite 10-year yields falling. Why is that so significant? Because while it’s normal for long-term rates to fall when stocks decline (flight to safety), it’s NOT normal for the 2-year yield to decline. Not when it’s been rising rapidly for over a year on expectations that the Fed would continue hiking (five or six more times per the latest dot plot).

But in recent weeks both the 10-year and two-year yield have been falling, in lockstep. This means the bond market is now saying, via billions in institutional fund flows, that it’s expecting the following:

  • Slower economic growth in the coming years (as we expected)
  • Weaker than expected long-term inflation (now 2%, The Fed’s long-term target)
  • Fed ending rate hiking cycle in just 3 more increases (not five or six)
  • NO yield curve inversion and NO impending recession
Federal Funds expectations

(Source: Kessler Investment Activities, Inc.)

In fact, the bond futures market, also where billions of dollars are at stake, is signaling that the Fed will only hike three more times. That would put the Fed Funds rate at 3%, the Fed’s best estimate of the neutral interest rate (neither accelerates nor drags on growth). Several Fed officials, including Chairman Jerome Powell himself, have indeed indicated that the Fed is only committed to getting us to that estimated neutral rate. Beyond that, the Fed’s interest rate decisions will come down to what the economic and inflation data says it should do based on the best available evidence.

Okay, so maybe we’re not headed for a recession next year, or even in 2020 or 2021, but what about the alarming decrease in analysts earnings forecasts for 2019? Surely that justifies stocks at least crashing into a bear market right? Actually, it doesn’t. That’s because since 2002 the annualized growth rate of the S&P 500’s earnings has been 7.5%. So even 9% growth, following 21% growth in 2018, would not be a disaster. In fact, it would be significantly above average growth.

What if those forecasts keep falling to below 7.5%? Well, then reasonable stock valuations are what is likely to prevent a bear market. What? Aren’t stocks in a bubble? Actually, the forward PE on the S&P 500 is now 15.2, which is between the five year average of 16.5 and the 10 year average of 14.5 (which includes the Great Recession when stocks fell 57%).

Don’t trust forward earnings? Well then consider the S&P 500’s trailing PE ratio, which today is 21.7. Sounds very high right? Especially since 1871, the average has been 15.7. But consider this, the average TTM PE for the market has been 20.2 over the past 40 years.

40-Year Average S&P PE Ratio

And that was when the average 10 year-yield was 6.3%. With long-term rates now at less than half that, 21.7 trailing earnings (which are falling rapidly due to tax cut boosted earnings in 2018) is far from “bubble levels”.

So what does that mean about this most recent market fall? Only that it’s likely to be a regular pullback or a correction. Since WWII there have been 57 pullbacks of 5% to 9.9% from the S&P 500’s all-time-high. On average they lasted 1 month (so this one is already overdue to end) and saw a max decline of 7% (9.9% was October 29th low). What if this becomes a correction?

S&P 500 Corrections

(Source: Wealthfront)

Well since 1965 those last, on average, three months, and see stocks decline 12.4%. But the duration of the correction is actually a function of how low stocks fall (because bargain hunters step in to put a bottom in when prices hit a certain point). As of yesterday the S&P 500 was down 8.2% from its September 20th high. Thus IF we end up falling into a correction (still technically just a pullback) then stocks likely have only about 4% more to fall. That’s before attractive valuations and solid economic and earnings fundamentals cause them to rise once more to new all-time highs just four months later (historical average recovery time).

Or to put another way, IF this becomes a correction then selling now is likely selling close to the bottom, which is the best way to lose money.

Bottom Line: The Most Recent Market Decline Is Being Led By Tech Stocks, Based Largely On Overblown Short-Term Fears And Stocks Are Likely Close To Bottoming

It’s never fun to watch your portfolio plunge fast and hard. However, it’s important to know the difference between short-term correction based on overblown fears, and a sign of an impending recession and bear market.

This retracement to previous pullback lows, which threatens to put the market into a full-blown correction, is primarily being driven by the former high-flying tech stocks that were for so long the darlings of Wall Street. That meant that these naturally volatile stocks became a large part of every major index, and are thus causing the market to fall at a rapid pace.

However, while the risks the market is obsessing over are very real, the fact remains that the tech bear market that is driving stocks lower is likely an overreaction. With the exception of NVIDIA, all the FAANG stocks reported good top and bottom line growth last quarter. And while guidance may have disappointed Wall Street, revenues and earnings for tech stocks, and corporate America, in general, are likely to still come in strong next year, historically speaking.

Meanwhile the bond market, the best recession predictor yet discovered is indicating that slowing US growth next year will NOT continue to a full-blown recession. And since WWII 82% of bear markets have occurred during recessions. That means that at worst, this latest market downturn is likely to prove a run of the mill correction, which is a natural and healthy prerequisite to stocks hitting new highs in 2019.

The best thing investors can do right now to protect their portfolios is nothing at all. If large daily losses might cause you to panic sell near what’s likely to be the bottom, then turn off the TV or stop checking your portfolio. Despite what the last few weeks might lead you to believe, the bull market isn’t likely on its deathbed, and strong economic and corporate fundamentals, combined with lower stock valuations, means the bull market likely has years more to run.


  • 1
  • 2
  • 3
  • 4
  • 5
  • 6
  • 7
  • 8
  • Home
  • Articles posted by Stock News
  • (Page 2)
  • Uncategorized

3 Lessons From the Recent Slide of Options

The fallout out from last week’s Natural Gas surge is still coming down. Its casualties range from professional and supposedly sophisticated hedge funds — ranging from their wealthy clients to small retail investors.  

Last week I wrote how Natural Gas’s huge move was exacerbated by hedge funds unwinding positions, which resulted in a 35% price explosion — likely leading to large losses and potential business collapses. 

Sure enough, several funds, including high-profile Andurand Commodities Fund lost 20 percent-plus in a matter of days.

Interestingly enough, this comes almost exactly 10 years after hedge fund Amaranth blew up and lost some $9 billion; clients are still waiting to recoup some of their money.   There’s a reason they call the natural gas market ‘the widow maker.’

A less high profile firm called Optionsellers.com presents a sad tale about how over 300 of its customer accounts were wiped out to the tune of $70 million.

This may not seem like a huge amount by Wall Street standards. But, when you consider that most of the accounts were held by small retail investors — many of which now actually have debits north of $100k — this was life ruining.

So what lessons can we learn?

Click the Next Page to find out.


1.Know with whom you are investing.  The firm’s website and most of the principles’ online presence has been closed or scrubbed. But some remaining screenshots show the company appeared highly promotional and less than professional.

The marketing material was filled with unrealistic promises and the strange practice of grouping its customers with labels such as “platinum member,” or “founders club” — based on the size of their account. This is the type of thing a newsletter does, not a professional money manager.

There are actually some questions whether this firm and its principals were even registered or qualified to run managed accounts.

A quick search also shows the firm and its president  James Cordier had been involved in prior securities fraud lawsuits and questionable practices.

Needless to say, new lawsuits are already being filed.

2. Know the Strategy: The name of the firm OptionSellers.com pretty much summed up their strategy.  They sold option premium.

They positioned this as a safe way to “generate income” which sounds conservative.  Unfortunately, they did it by selling “naked” or uncovered options, meaning on margin, which comes with unlimited risk — something I’m sure most of their clients didn’t fully understand or appreciate.

I’m not even sure the people managing the accounts understood the risk.

The president of the firm issued this strange video trying to explain what happened.  He does a lot of call-outs to individuals telling them how sad he is that he’ll never get to go bass fishing, but barely explained what actually happened.

3. Know Yourself: It’s crucial to understand your own personal goals, risk tolerance and level of knowledge.  


  • 1
  • 2
  • Home
  • Articles posted by Stock News
  • (Page 2)
  • Uncategorized

Has the Value of the US Dollar Peaked?

Over the weekend, there were a lot of opinion pieces about the state of the US Dollar.  Some were very pointed in their belief that the US Dollar has peaked, while others were presaging its demise. This is because China can do things with credit that the US can’t.  A few laid out very specific reasons why last week’s high may very well be more than a local peak; remember the old trading saw, “technicals precede fundamentals.”

Is there any truth to all of this?  And if so, which way are the technical signs pointing – if technicals indeed precede fundamentals.  First, let’s look at the six-month chart:

UUP chart

Source: Fidelity.com

Well not much help there, that’s just a classic steady run-up chart. The very basic technicals — volume, RSI, 100-day SMA — aren’t saying too much other than we probably just hit a local top. RSI is falling fairly fast right now, which is typical behavior after either a short- or long-term top.

Let’s try a longer-term chart (on the Next Page):

UUP five year chart

Source: Fidelity.com


Well, your Gold Enthusiast looked at the one-year chart and it didn’t say much more. Also, the two-year chart isn’t quite telling enough of a story either.  So, unfortunately, we’re into a five-year chart.  In general, your Gold Enthusiast doesn’t like five-year charts for two basic reasons: One, the candles get so small they’re hard to see with aging eyes; and two, who the heck thinks conditions are similar enough over five years so, the chart actually says anything valid?
In response, we’ll have to concede that we are still in the longest bull run in US stock market history.  So conditions really have been similar until now over the past five years.  What we’re looking for is the end of this period, so it does make sense that we look at a five-year chart, because when things change the chart will show it.

Unfortunately, even this chart doesn’t spell out an impending doom or massive opportunity. The USD isn’t at an overall peak even for two years. In fact, it’s bouncing off the secondary peak below the highest peak.  So, the farthest out on a limb you can go with basic technicals is that it’s too early to tell if this is “the last” peak, or if this is just another wave in the trend.
Things we’ll be watching: The Euro, since it makes up over 50% of the US Dollar index — The EU and Italy are locked in battle right now (darn deficit spending!); any move by China toward a hard currency, i.e. backing yuan/RMB with gold; any sudden run-up in interest rates.  Those are probably the most significant canaries in this coal mine.

Signed, The Gold Enthusiast

DISCLAIMER: No specific security was mentioned in this article.  The author is long the gold mining sector through a small portfolio of ETFs and specific mining stocks.

  • 1
  • 2
Tagged with: us dollar
  • Home
  • Articles posted by Stock News
  • (Page 2)
  • Uncategorized

Oil Plunges and Natural Gas Soars, What to Make of These Extreme Moves

A month-long slide in oil and sudden surge in natural gas price is impacting global stocks, the bond market, hedge funds, and consumers. Here is what is causing the moves and what might happen next…

In natural gas, which is widely used to heat homes in northern U.S. and Canada, a change in weather forecasts over past few days has pushed futures to $4.40 per BTU, which is a 35% surge in just one week, and settled at its highest level since February 2014.  

1

Source:Stockchart.com


Meanwhile, oil has taken a steep tumble, going from a year high of about $76.50 to a new 52 week low of $55.50, which is a 28% decline in less than a month.  This month included a record 12 consecutive down days for oil; the most rapid in the 45 years of tracking the data.
2Source:Stockchart.com


The Big Unwind

The opposing price moves in natural gas and oil has accelerated over the past few days, as many people believe one or more large hedge funds were forced out of what is now a losing trade.

Mark Fisher, head of MBF Asset Management, spoke on CNBC this morning and said the price moves the past few days were exaggerated by hedge funds unwinding massive paired trade long oil/short natural gas saying, “They’ve been playing this aggressively all year and swiftness has more to do with forced liquidation rather than dramatic shift in fundamentals. Several might be put out business here.”   

Fisher thinks today could represent the culmination of the unwind and therefore we’re near the lows for oil.

3

Source:Freestockchart.com


Supply vs Demand Explains Why

It is unusual to see such a divergence in between oil and gas, especially one this extreme.  But recent developments in drilling, particularly in fracking has changed the supply/demand equation.

Essentially the world now has too much of light crude oil, that comes mostly from the U.S., which are most suitable for producing gasoline and too little of the heavier crude oil varieties that come from OPEC and South America which are better for diesel, jet fuel, and fuel oil. 

The consensus is that the decline in oil is mostly the result of too much supply, as OPEC failed to stick with their proposed production cuts. Russia and Saudi Arabia are now reportedly discussing cutting output by 1.4 million barrels per day.

Ziad Daoud of Credit Suisse calculates that weaker demand accounts for $18, or 85%, of the price decline, while supply is responsible for the remaining 15%. In deriving his calculation, Daoud observed that the IEA (and even OPEC) recently lowered their forecasts for the growth in oil demand next year, citing a slowing global economy caused by rising trade tensions, higher interest rates and turmoil in emerging markets, as the reason behind the downgrade.


4

On the other hand, natural gas demand has increased the first half of 2018 by 12%, compared with a year earlier. Exports have also doubled on average this year compared, with 2017, according to the EIA.

This record natural gas consumption comes as we now head into the winter heating season, with fewer supplies in storage than any other year since 2005.

The Northeast, which lacks the pipelines needed to move natural gas, experienced even sharper price increases, which could impact heating bills this weekend.


Market Impact

The stock prices for energy companies have been damaged due to the decline in oil prices, and it’s causing a sharp rise in yields in the corporate bond market.  The energy sector accounts for about 15% of the entire U.S. high-yield bond index.
5Source: Bloomberg

It would seem that the jump in natural gas prices is mostly seasonal, and the negative impact on consumers could be mostly offset with lower gasoline and heating oil costs.

But if oil is declining because of a slowdown in global growth, this will impact not only oil producing countries, but also impact the bond market, creating a higher borrowing costs, which could lead to defaults, which in turn could have a ripple effect across other financial markets.


  • 1
  • 2
  • 3
  • 4
‹ Older posts
Newer posts ›

©2025 StockNews.com
About Us | Contact Us | Performance | Privacy Policy | Terms of Use | Supplemental Terms

Copyright © 2025. Market data provided is at least 10-minutes delayed and hosted by Barchart Solutions.
Information is provided 'as-is' and solely for informational purposes, not for trading purposes or advice, and is delayed. To see all exchange delays and terms of use, please see disclaimer.

This site is protected by reCAPTCHA and the Google Privacy Policy and Terms of Service apply.

Information contained on this website maintained by Magnifi Communities LLC is provided for educational purposes only and are neither an offer nor a recommendation to buy or sell any security, options on equities, or cryptocurrency. Magnifi Communities LLC and its affiliates may hold a position in any of the companies mentioned. Magnifi Communities LLC is neither a registered investment adviser nor a broker-dealer and does not provide customized or personalized recommendations. Any one-on-one coaching or similar products or services offered by or through Magnifi Communities LLC does not provide or constitute personal advice, does not take into consideration and is not based on the unique or specific needs, objectives or financial circumstances of any person, and is intended for education purposes only. Past performance is not necessarily indicative of future results. No trading strategy is risk free. Trading and investing involve substantial risk, and you may lose the entire amount of your principal investment or more. You should trade or invest only “risk capital” - money you can afford to lose. Trading and investing is not appropriate for everyone. We urge you to conduct your own research and due diligence and obtain professional advice from your personal financial adviser or investment broker before making any investment decision.

StockNews, a division of TIFIN Group LLC, is affiliated with Magnifi LLC (“Magnifi”) via common ownership. Affiliates of Magnifi will receive cash compensation for referrals of clients who open accounts with Magnifi. Due to this compensation, a conflict of interest exists since StockNews has an incentive to recommend Magnifi. Please see Magnifi’s Form ADV for additional information about fees and charges that may apply.