StockNews.com
  • Login Join

StockNews.com
  • News
    • Top Stories
    • Video News
  • Best Stocks
    • "A" Rated Stocks
    • Upgrades/Downgrades
    • High Yield Dividend Stocks
    • Stock Screener
    • Top Stocks by Target Price
    • Dividend Discount Model Stock Valuation
    • Industry Rank
  • Best ETFs
    • "A" Rated ETFs
    • Best ETF Categories
    • High Yield ETFs
    • 7 Best ETFs
  • POWR Ratings
  • Upgrades/Downgrades
  • Watchlist
  • Screener
  • Services
    • Services Home
    • POWR Platinum
    • Reitmeister Total Return
    • Stocks Under $10
    • POWR Options
    • POWR Value
    • POWR Screens 10
    • POWR Income Insider
    • Premium
  • Login Join


  • Home
  • Articles posted by Steve Smith
  • Uncategorized

Will Zuora (ZUO) Continue Up the Comeback Trail?

Zuora (ZUO)  “provides cloud-based software on a subscription basis that enables companies in various industries to launch, manage, and transform into a subscription business.”    

Basically, Zuora helps legacy businesses move from a single sale to what in the software world is known as a ‘software as a service” or SAAS model.  It worked for huge companies like Microsoft (MSFT) and Adobe (ADBE) and I imagine it is working for many smaller companies that need 3rd party back end support.  This is a hot trend, and the company is acquiring new business at a rapid pace with year-over-year revenues growing 47%+ over the past six quarters. 

Then disaster struck when during the last earnings call in May when the company posted lower-than-expected numbers with a significant slowdown in sales and lowered guidance. Management said the company needs to improve on sales execution. But, despite expanding its strategic sales team in the last year, it forecasts weaker second-quarter performance. New sales staff are half as productive as experienced staff. With revenue growth failing to offset the growth related to higher staff costs, investors need to wait patiently before the business re-accelerates. 

That uncertainty sent the stock plunging by some 30% on that single day. However, it is slowly starting to make a come back.

zuo 2019 stock chart

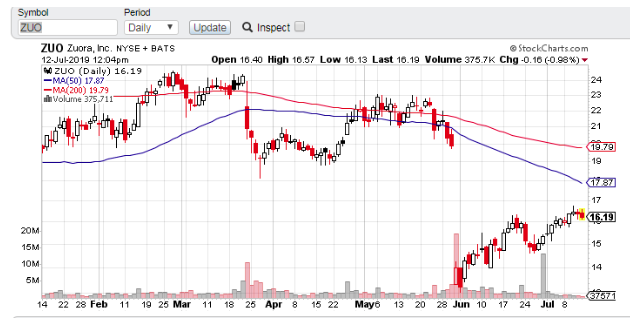
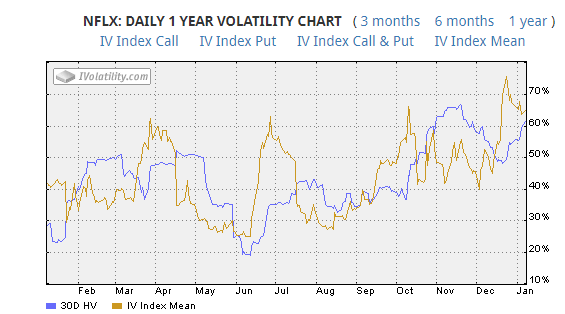
The options are fairly liquid (it helps they are only monthly so volume isn’t splintered among too many strikes and expirations. But, that’s another discussion) and implied volatility is in the lower 5th percentile in ZUO’s 10-month history, making the outright purchase of calls a good leveraged play. 

-Buy to open ZUO September 16 strike Calls at $1.10 per contract 

snapshot analysis zuo order ticket

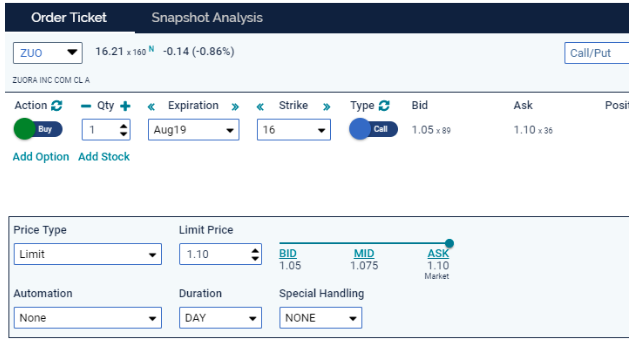
This allows a few months for the stock to continue climbing, and it also includes the company’s next earnings even on Aug. 29. This means the calls will not only retain their value leading up to the release date but also provide an opportunity for the company to redeem itself and send shares sharply higher.


  • Home
  • Articles posted by Steve Smith
  • Uncategorized

What You Need to Know Before This Earnings Season

Earnings season officially kicks off next week when big banks such as CitGroup Inc. (C), and JP Morgan (JPM)  report Monday and Tuesday while the first of FAANG, Netflix (NFLX) reports on Wednesday, July 17.  

After a few months of being waffled and swayed by political trade talk and Central Bank interventions, it will be nice to hear directly from the corporate leaders about how their companies are doing and what their expectations are for the second half of the year. 

Given the above cross-currents, this could prove to be a very pivotal quarter as to whether the economy can maintain its expansion or it risks slipping into a recession. 

But even with the larger macro issues aside, earnings can be very tricky to trade as there are many moving and unknown parts; will the company miss or beat expectations, what will be the guidance, will traders ‘sell the news’ in profit taking and will the recent overall market volatility override the results?

But there is one predictable pricing behavior that savvy options traders use to produce steady profits.  

The biggest mistake novices make is purchasing puts or calls outright as a means of a directional “bet.”   They are usually disappointed with the results as even if the stock moves in the predicted direction, the value of the option can actually decline, resulting in a loss despite being “right.” 

Don’t Get Post Earnings Premium Crushed 

The problem is that they failed to account for the Post Earnings Premium Crush (PEPC) which is my label for how the implied volatility contracts sharply, immediately following the report no matter what the stock does.  

You can see the repeating pattern of implied volatility of Netflix’s options spiking and retreating on the quarterly reports. 

nflx 1 year volatility chart

Source: iVolatility.com

 You’ll often hear traders cite what percentage move options are “pricing in” on the earnings.  The quick back of the envelope calculation for gauging the magnitude of the expected move is to add up the at-the-money straddle.  

This article does a great job of explaining how to use the straddle to both assess expectations and potentially profit. 

Once option traders are armed with this bit of knowledge they to advance to use spreads to mitigate the impact of PEPC when looking to make a directional bet.  Some will graduate to getting this predictable pricing behavior in their favor by selling premium via strangles or the more sensible limited risk iron condors. But these strategies still carry the risk of trying to predict if not the direction, then the magnitude of the move.  

Here’s a list of the historically most volatile stocks following earnings reports.  Which means they are likely to see both the largest increase in implied volatility leading up to earnings and the largest PEPC. 

The Pre-Earnings Trade

The true professionals pursue a safer and more reliable path of positioning in anticipation of the increase in implied volatility that precedes earnings and avoids the actual event altogether.  Just as PEPC is predictable so is the pumping up of premium leading into the event; it’s just more subtle in that it occurs incrementally over the course of many days. 

One strategy for taking advantage of rising IV leading into earnings is a calendar spread, in which you sell an option that expires prior to the earnings while simultaneously purchasing one that expires after the event.  Like any calendar spread, it will benefit from the accelerated decay of the nearer-dated options sold short. But this has the added tailwind of as earnings approach the option which includes the earnings will see it IV rise causing the value of the spread to increase.  To keep the position delta neutral both put and call calendars should be established.  

These positions must be established in advance and closed before the actual earnings.    The profits might not be as dramatic as catching a huge post-earnings move but they can be substantial.  More importantly, they can be consistent and have a high probability. 

With weekly options, there should be plenty of situation in coming weeks to take advantage of the rise in IV leading into earnings.  This site provides a good starting point of a list of names and their options specific pricing tendencies.   

With most offering weekly options there should be plenty of opportunities for double calendars. As always, do your own research and confirm the reporting dates but this offers a great starting point.  

For those that want to gravitate towards where the action or expected biggest moves, here’s a list of names that have displayed most volatility post earnings reports. 

volatile us stocks 10 year earnings report

Just remember, a big move doesn’t guarantee a profit, you still has the direction and what the options expectations were pricing in at.  Good luck, and happy earnings. 


  • Home
  • Articles posted by Steve Smith
  • Uncategorized

Have Option Gamma Trades Taken Control of the Market?

Back in my day as a market maker on the floor of the Chicago Board of Options Exchange (CBOE), the third Friday of the month was known as ‘gamma day.’ That was prior to 2005 when weekly options were introduced—to show my age I was on the CBOE from 1991-2002—and ever since ‘gamma day, it has been a weekly occurrence. 

Actually, with some Index and ETFs like SPY having expiration three times a week (Monday, Wednesday Friday), Gamma scalping has become a full-time feature of the trading landscape and as this article from the Wall Street Journal, it may be warping price and volatility levels.   

The nut of the piece is, there’s a powerful force at work in the market that helps explain why stocks seem to do nothing for long periods and then suddenly lurch into activity. Market players have noticed this force—known by some as a “gamma trap”

Before getting to implications, let’s drill down into the definition and mechanics of what an options Gamma is:  

Gamma is a second derivative and measures how much your delta will change per unit change in price.   It means that as prices rise your delta increases. Or more pertinently, as prices decline, your delta turns more negative, meaning you get longer as prices go up, and shorter as prices decline.  Sometimes people confuse gamma with vega which is a measure of volatility. They sometimes act in concert, but are not related.  Kind of like country and western. I have no idea what that means but you get the gist. 

Notice how an options delta becomes more sensitive as expiration approaches.  Essentially, on expiration day an ATM option acts just like owning or shorting the underlying shares. 

As time approaches expiration, the gamma level of an option increases. Like time premium levels, gamma also falls under the normal distribution curve with the at-the-money (ATM) options having the highest levels of gamma. This is why most people who gamma scalp elect to do so by using the ATM options to buy (or sell if reverse gamma scalping) straddles and strangles. 

Here is a graph of the gamma curve:

atm option gamma curve

Gamma scalping is the process of adjusting the deltas of a long option premium and long gamma portfolio of options in an attempt to scalp enough money to offset the time decay of the position.

In practice, at least in my day, it simply meant buying both a put and call (usually ATM) on expiration and the buying or selling shares as the underlying price rose or fell, to pick up incremental or ‘scalp small profits’ while maintaining a delta neutral position.  

This had the tendency to dampen volatility because as prices rose, market makers would sell stock or buy stock as prices fell.  This often led to the phenomena known as pinning the strike price at expiration. 

Since the advent of weekly options, you can see how their popularity has grown especially over the past few years in which their volume surpassed the ‘regular monthly’ contract.

spxw chart 2019

The Journal article I mentioned is making the case that big investors such as institutions and hedge funds have actually been engaged in “negative gamma” which would entail selling both puts and calls to collect a premium.  

If you are short gamma (net short options and hence volatility) you usually have to take a defensive stance when large moves occur trades put them at high risk of compounding losses and setting off a self-fulling bout of ever-increasing volatility. 

Meaning, as prices rise one is forced to buy or as prices fall one is forced to sell.  This creates a feedback loop. We are already seeing that days with higher negative gamma are producing larger negative returns.

gamma exposure billions chart

We saw in February of 2018 how an overabundance of people short volatility of VIX products, which is the ultimate negative gamma position, led to Black Swan known as the VIXapocalyspe, causing many funds to go out of business and trillions of dollars in losses. 

If due to the recent drop in interest rates people try to generate income by selling option premium or shorting volatility, they could create a real danger to market dynamics.  It’s like picking up pennies in front of a steam roller; eventually, you and everything in its path gets flattened.

  • Home
  • Articles posted by Steve Smith
  • Uncategorized

Who Will Win Between the Bulls & Bears After this Pivotal Weekend?

The first half of 2019 comes to a close today with the stock market sitting just below all-time highs and up some 18% for the year to date ranking it as the 4th best start to a calendar year in nearly 30 years.  Impressive!

We are now heading into a pivotal weekend in which Trump’s meeting with China’s Xi could decide the direction and ultimate winner of the second half. 

For starters, it should be noted that if you look at the market on a more continuous basis the past 9-12 months less bullish view than the calendar date headline. 

As you can see the path to back all-time highs has been rocky.  A steep drop at the end of 2019 followed by a near vertical recovery into May before trade talks collapsed causing another pullback followed by a quick rebound. 

Now here we stand exactly where we were 9 months ago with the S&P 500 Index (SPX) knocking for the third time at the 3,000 level. 

s&p 500 large cap index 2019

Before going into my thoughts on why I think there is a risk of the market turning lower, I need to acknowledge that bears be warned, precedent is not on your side. 

Historical data suggests that — based on a strong first six months of the year — that stocks will go onto a new bullish leg higher in the second half. 

Research from CFRA shows that over the past 50 years when the market is up more than 5% in the first 6 months, it goes on to gain another 4.8% in the second half of the year. 

Even more bullish is the data showing that if stocks are up more than 10% in first half, they finish the year with an average 23% gain. 

With that caveat clear, the reasons I believe the market is vulnerable to a decline rests on these points. 


  • Central banks are back to easing policy pumping up risk assets.  


ECB’s Mario Draghi said that he is ready the engage in a new round of quantitative easing the Fed’s head Jerome Powell all but promised a rate cut in July. 

With global rates already zero bound, more cuts will do nothing to stimulate the real economy. It merely creates punishes savers, allowing weak or zombie companies to stay alive— reinforcing the notion that there is no alternative to stocks (TINA). 

Even with the sea of liquidity without real demand, spending and earnings growth stocks will be unable to sustain current valuations.  


  • Trade War Will Not Cease


While this weekend’s meeting between Trump and Xi is seen as pivotal, I don’t think much will change.   

There are expectations that the two will call for a truce and a resumption of talks rather than an acceleration of tariffs. But that is far different from a resolution and the lack of clarity will continue to hang over the market. 

And there is near certainty that Trump will continue to threaten heightened tariffs, not just on China, but other countries as he views it as a powerful tool for a variety of policy agenda, ie the short-lived threat against Mexico to address immigration issues. 


  • Valuations Unattractive as Earnings Decline


Companies avoided the predicted ‘earnings recession’ during the first quarter but might not be so lucky in the upcoming second quarter. 

The breakdown of trade talks and slowing global growth looks to be catching up with both corporate profits and consumer spending.  Analysts have not reduced their estimate by much over the past 60 days, and I expect many companies to fall short and issue full year guide downs. 

I’m not declaring an upcoming bear market nor am I discounting the possibility of a push or even melt up higher.  But given the above, I think there is a risk to the downside and investors should proceed with caution.

  • Home
  • Articles posted by Steve Smith
  • Uncategorized

Will Semiconductor Stocks Continue to Rally?

Semiconductor stocks enjoyed a strong day after Micron (MU) reported better-than-expected earnings and provided an optimistic outlook.  This helped boost sentiment for the sector after the group suffered due to trade tariffs concerns about oversupply and a global slowdown. 

But, given the semiconductor/chip sector’s past being littered with booms and busts due to vicious cyclicality in memory prices, a drill down into the numbers suggests it may not be all clear.

For its part, Micron shares surged 14% after the chipmaker’s CEO continued to predict a second-half rebound in the memory chip market, and more importantly, said it had found a workaround for the sanctions against Huawei, resuming shipments to the world’s largest maker of cell phones.  

micron technology

As you can see on the Semiconductor ETF (SMH) chart, after a weak end to 2018 the group went on a huge run to new highs through the first 5 months of 2019. This was on the belief that there would be a pick-up in demand and pricing power in the second half.  

Then the trade talks with China fell apart, coupled with the US forcing boycott of Huawei, bringing chip shipments came to a near standstill. 

Today’s Micron-induced rally brings SMH right back to a key level at the $107 area. 

smh vaneck vectors semiconductor etf

I think the response to the Micron report is overly optimistic and the sector is still in a cyclical slowdown as trends at the end of 2018 not only remained in place, but may have gotten worse. 

The entire tech industry, a highly-integrated, global supply-chain with China as a cornerstone froze in disbelief, and business virtually halted. This resulted in a steep fall in ASPs (average selling price) in DRAM/NAND, prompting a wave of downgrades of the memory players. 

Trade talks have not improved and the notion that Micron or other companies can circumvent Trump’s order to ban doing business with Huawei seems suspect. 

Also, a drill down into Micron’s numbers reveals that they were not strong as they seemed and the CEO’, who has a history being overly optimistic, isn’t grounded in the fundamentals. 

Micron’s CEO acknowledged on the conference call that “DRAM&NAND markets remain oversupplied,” but expects to see a “restore of demand & supply balance over the next few quarters.” That’s fairly vague and very hopeful considering most expect a steep cut in cap-ex spending for the reminder of the year and central banks are acting like a global recession is coming.  

While the company “beat” estimates the fact is that earnings, both top and bottom, are expected to continuing contracting sequentially for the next two quarters and be down by over 50% year-over-year. 

More concerning is that MU’s inventories jumped another $500 million and now stand at $4.9 billion, representing over 150 days of inventory.  Bloated inventory is especially problematic in the semi space as Moore’s law is still in effect. As next generation chips come along, it renders the old ones obsolete. 

Micron can’t keep accumulating inventories as demand and prices sink without eventually forcing it to take a huge “non-GAAP” write-off.  A precursor is having inflated all the prior quarters’ margins when inventory piled up MU’s stock buybacks collapsed to nearly nothing last quarter. 

In fact, just today, Intel (INTC) plans to cut desktop processor prices by up to 15% in response to news that Advanced Micro (AMD) is expected to release their 3rd generation Ryzen processors. 

The semiconductor cycle has not yet troughed and I expect the shares of chip makers will head back down. 

  • Home
  • Articles posted by Steve Smith
  • Uncategorized

Can Housing Stocks Keep Climbing?

After a very weak second half of 2018 due to rising mortgage rates, the S&P 1500 Homebuilder group has rallied 35% in 2019 to a new 52-week closing high as of last Friday.  But, recent data suggests that fundamentals don’t warrant continued gains. 

This morning, new home sales for May came in at 626,000 which was 7.8% below expectations and April numbers were also revised downward. 

This is a huge disappointment given spring is the prime season for home buying and the recent drop in interest rates should have spurred activity. 

Of more concern is that a number of new homes on the market rose by 5% to 333,000; representing nearly 7 months of inventory, up from 4.5 months at the beginning of the year and the highest level in nearly 3 years.  

This a sharp change from a year ago when the storyline on what was holding the housing market back was a lack of new homes, especially on the lower end or entry level of the market.  

Despite these numbers, most housing stocks and the SPDR Homebuilders ETF (XHB) were up on the day even as the broader market was lower.  This was probably thanks to Lennar (LEN) whose shares rallied by over 5% after posting stronger than expected earnings. 

Investors took heart in comments from Lennar’s CEO who said during the conference call “after a market pause in the second half of 2018 set the stage for more moderate home price increases and lower interest rates, which stimulated both affordability and demand, leading homebuyers back to the market,” helping boost margins to 20% from 16.2% from the year-ago period.  

Indeed, interest rates seem to be the main driver in housing stocks’ performance.  As you can see from the S&P 1500 Homebuilder group chart vs. an inverted look at Bankrate.com’s 30-year national average fixed mortgage rate, the correlation between rates and the stock price is clear, as the homebuilder group bottomed right around the time that mortgage rates peaked, and they’ve been rallying as mortgage rates have been falling.

Given job security is probably the number one factor when considering purchasing a home one would think that with unemployment below 4% and wages finally rising the housing market would be picking up with greater demand. 

The bull case is supposed to be further bolstered by the fact that household formations have now built up pent up demand, especially given that the rental market has seen very large price increases, should finally motivate millennials to move out of their parents’ homes and start a family of their own.   

The millennials born during the early 90’s represented the highest birthrate since the 1950’s boomers with over 4.2 million births in 1990 alone.

us births per year 1909 to 2015

That bulge in births has led to the U.S. now currently having the largest population in the prime 24-54 age bracket in its history in the coming year; some 125 million.  They are now coming of age when they should start forming families.  

prime age population 25 to 54

Demographics and household formation suggests that housing starts would need to increase by 35% over the next few years to meet demand. 

Three issues that are restraining demand for single-family homes are:

1) The trend of people moving into more urban centers, and developments that offer a wide range of amenities within walking distance.

2) People delaying or choosing not to have children.

3) The average price of a new home is $330,000 which is still out of reach for a majority of people. 

The former is could be a sustainable trend and would bode well for firms focused on multi-family apartment complexes. My top pick for exposure there is Avalon Bay Communities (AVB) 

The latter can only be solved by building more starter homes at lower prices and improving economy. 

This morning’s sales number and recently general economic data shows a slowdown in growth, which won’t matter how low interest rates go. This is because home sales will remain below trend. And that spells trouble for the homebuilding stocks. 


  • Home
  • Articles posted by Steve Smith
  • Uncategorized

3 Steps for Using Options to Protect Your Portfolio

With the stock market having a sizzling run to new all-time highs, investors are rightfully asking how they can protect their gains while still retaining upside exposure.

This is where options trading can be extremely helpful.  The most straight forward and simplest form of hedging or limiting downside risk is buying put options.  

While it is essentially true that ‘put protection’, as measured by the VIX or volatility index, is now less expensive on a relative basis than it was in past years. It can still prove quite costly on an absolute basis in terms of the drag on your returns.  

Two of the mistakes investors make in using puts for hedging protection are:

  • The buy more insurance needed relative to their holdings or risk profile
  • The buy puts that outright are too far out-of-the-money which only provide only “disaster protection” rather than buffering more likely 10% decline.

Let’s look at some of the concepts for buying the right and appropriate portfolio protection.   

Spreading

In my options trading, I try to have individual positions that have their own internal hedges by using spreads. These usually take the form of basic vertical spreads in which you both buy and sell options with the same expiration but different strike prices.  

The essential function of a spread will be reducing the cost and mitigating the impact of changes in implied volatility and the negative impact of time decay time.

I also frequently use options on the Spyder Trust (SPY) to provide the overall portfolio with broader protection. Typically, individual positions tend to be bullish, while the portfolio protection chunk usually consists of the purchase of puts or put spreads. Let’s take a look at how this concept can be applied to a less active and basically bullish-oriented portfolio.

Buying put options does offer the most complete and probably efficient way to hedge a position, but it comes at a cost. That cost, as with all insurance policies, will be a function of the amount of protection and its duration.

The main items to consider when choosing put protection, whether for an individual stock or a broad equity portfolio, are as follows: 

What Magnitude of a Decline is Expected?

Like any insurance, there are two basic components to what type of coverage you decide to purchase.

  • How much damage or what level of the decline do you want the position to be fully hedged or protected?
  • The term or for what length of time do you want the protection in place?

Answering these questions will help you determine the appropriate number of puts to buy at a given strike with a certain expiration date. By using the basic application of delta in which an at-the-money option is expected to move $0.50 for every $1 unit price move in the underlying security, one can begin to assess how much and at what levels cost protection can be purchased.

Combination Approach 

If you’re really looking for a true, longer-term hedge — that is, you don’t expect to make many changes or adjustments to your portfolio for six months or more — using a combination of strategies might make sense.

For example, I suggest the following three-step approach, which uses SPY options to create portfolio protection for a $150,000 portfolio:

1. Buy a put spread of closer to-the-money strikes that have about six months remaining until expiration. With the SPY trading around $285, one can buy the January 2020 285 puts and sell the January 270 puts. Such a spread could be bought for around $3.00 net debit. For a $150,000 portfolio, purchasing about 100 of these might provide reasonable protection. But because we’re protecting it in two ways (read on), buying 25 spreads should suffice.

2. The next step is to sell a call spread for a credit, such as selling the January 300 calls and buying the January $310 calls. This call spread can garner about a $2.50 net credit. Remember, as a spread, this won’t limit your upside. You could probably sell up to about 50 or 60 of these spreads.

Just be aware that there’s a “dead zone.” If SPY is between 300 and 310, then you’ll lose $7.50 on this position. But I assume you’d be making money if stocks rallied another 15% to $310 SPY points from current levels. You can use higher strikes or sell fewer spreads to align with your risk profile.

3. Finally, use the proceeds of the call spreads to buy some out-of-the-money (or OTM) puts outright to provide deeper downside protection. For example, the $7,000 proceeds from the call spread would finance the purchase of about 20 of the January 255 puts. These OTM puts give you outright disaster protection should the market incur a 10% or greater decline.


The total outlay would be about $11,000 — or about 7% of the $150,000 portfolio — which isn’t too steep for over 8 months of portfolio insurance.

This is just a loose construct — you can play around with the numbers — but I think the best hedges will ultimately involve more than simply picking one strike.

  • Home
  • Articles posted by Steve Smith
  • Uncategorized

The Alternative Way to Play Plant-Based Meat

While companies like Beyond Meat (BYND) and Impossible Burger are grabbing all the headlines, and investor dollars, there is a better way to play the alternative meat trend.

Beyond Meat shares have soared some 600% since it’s May IPO and now sports a near-$12 billion market capitalization.  The company hasn’t yet made a nickel, and trades at a staggering 75 times sales. At that valuation, and with larger food producers such as Tyson Foods Inc. (TSN) moving into the space, it looks very much like a bubble and isn’t a stock I would touch.

But there is no denying the trend towards meat alternatives. It will likely continue to grow as people convert to healthier vegetarian diets. Beyond Meat products are full of fats and sodium– but it’s seen as a means to reduce the huge industrial farming of cattle, pigs, and chicken, which is deemed unhealthy for the planet.

The switch to alternative meats is focused on reducing greenhouse gases and climate change, which are viewed as the number one threat to society, especially by the younger generation.

The key to figuring out how to profit from the trend towards plant-based “meat” is to look down the literal food chain.

These new-fangled proteins are made using a variety of plants including pea and soybean protein as well as various oils from plants such as coconuts and sunflowers.

As with all arable farming, the process starts with the seeds. Some seeds are better than others and sell for a higher price than do less desirable seeds. That means we need to look for the companies that have a history of developing seeds that farmers will buy.

This is where Corteva (CTVA) comes in. The company is purely in agribusiness with a large seed division. The firm boasts “integrated and greatly expanded solutions that combine genetics, chemistry, and precision agriculture.” Such solutions include pesticides, and most notably for these purposes, soybean seeds, one of the key ingredients for Impossible Foods’ meatless burgers. 

The company was recently spun out of DowDuPont (DWDP) just last month and remains under most analysts and investors radars.

It’s first earnings report as a standalone public company should come in late July. Initial estimates think the company can earn about $1.50 per share meaning at the current $27 per share its trades at just 18x eps.

This is a new name and a relatively pure way to play the emerging trend in alternative meat.


  • Home
  • Articles posted by Steve Smith
  • Uncategorized

Why I Hope the Fed Does Not Cut Rates

Stocks began a steep slide in early May when trade talks with China were halted which culminated at a low in one month later when the proposed tariffs with Mexico were put on hold.  During the ensuing 11 trading days, the major indices have galloped an impressive 7.4% higher, and are now a mere 1.2% from all-time highs.

To my mind, this investor’s bullishness is severely misplaced, and the financial markets seem to be putting too much trust that the Federal Reserve will begin a series of interest rate cuts, possibly as soon as tomorrow’s FOMC meeting.

I’m betting, or rather hoping, the Fed does nothing and resumes its stance to be data dependent rather than lean towards pre-emptive action.

When Jerome Powell first became Chairman of the Federal Reserve in late 2017, he seemed determined to act independently from both politics and the stock market, outlining a monetary policy that would be based on economic conditions and a decidedly conservative bent regarding things such as debt and unconventional tools such as quantitative easing which distort the cost of money (ie ZIRP) that cause financial repression and lead to inordinate risk-taking.

His plan was to raise rates and reduce the balance sheet in a very mechanical process until they reached what he perceived as “normal” for a non-crisis environment.

I was ecstatic; we could finally get back to trading based on fundamentals and technical analysis without all this Fed talk about “punch bowls and sugar highs.”

Well, as Ronald Reagan famously said in his 1980 debate with Jimmy Carter “There you go again.”

Last month, Powell and other Fed Governors began indicating that given some slowing economic data that a rate cut, or two or three, might order over the coming months.

This morning, ECB head Mario Draghi sent yields tumbling, with half of Europe now with negative interest rates, after saying he was ready to supply more stimulus.

The U.S bond market followed suit as the yield on a 10-year has sunk to 2.01%, the lowest level in over two years.

The reality is the data in the U.S hasn’t really slowed at all, it’s merely growing at a slower rate.  But, the market sell-off at the end of last year following the December rate hike must have spooked Powell and hence the initial pivot.

That turn in positioning has only become more pronounced as the trade wars have heightened and now threaten a true slow down.

The irony is that President Trump, who has been criticizing and trying to bully Powell into cutting rates for months, may, in fact, be forcing his hand by escalating the tariffs.  Some even believe that Trump is doing this on purpose to orchestrate a renewed bull market that would then go into hyper-mode when he reaches a deal prior to the election.

With the range of options for this week’s Fed meeting still wide open and the outcomes of the Group-of-20 summit look unlikely to yield any trade agreements the markets seem too sanguine.

Yet despite the potential for major market moves from these events the options market volatility risk premium is significantly below its historical average.

A report from JP Morgan (JM)  cited a gauge of implied to realized volatility using 12 measures across five asset classes, saying, “Option markets have not embed enough cushion against the significant event risk markets are facing over the coming weeks.”

Implied to Realised Vol ratio

“Other oddities include a large number of short positions on futures tied to the VIX — the so-called fear gauge tied to U.S. stocks — and a low amount of hedging as seen in the put-to-call open-interest ratio for S&P 500 Index options, the JPMorgan team wrote in a note Friday.

Also of concern, is the heavy allocation to U.S. equities especially from hedge funds concentrated in the same stocks as the S&P 500, while in equity futures it’s near the top its historical range.  

The resilience of the equity market suggests investors are leaning on the thesis of a preemptive Fed in that they might lose the power of surprise should they hold off this week, then lower rates in the aftermath of a negative outcome on trade talks.

That leaves equities vulnerable to a Fed disappointment. A more cautious and patient Fed next week could cast doubt on the above thesis, creating the risk of an equity market correction.

I’m hoping Powell if not taking away the punch bowl, at least doesn’t spike it more. Eventually, that hangover will be a doozy.


  • Home
  • Articles posted by Steve Smith
  • Uncategorized

Options Trading: Profit and Probability Discussion [Part 3]

If the 2016 election results and market response taught us anything, it’s to expect the unexpected and make sure your positions and portfolio can withstand even the most outlier of events.

In [the first part] of this series, we looked at how to properly measure risk and return, before even stepping in the batter’s box.  In [the second part], we walked through the value of creating the right risk/reward to make sure you’re swinging at fat pitches.  

In this installment, to further torture the analogy, I show how taking a “walk” — to get on base — is a crucial part of the game.  That is, there are some positions in which you don’t need to do much of anything, except exhibit patience, and you still get to first base.

I’m talking about positions in which options are sold for a credit.  If the value of the options declines a profit can be realized. The profited is limited to the sale price or premium collected.  The maximum profit would be realized if the option expires worthless.

Typically credit positions involve puts, calls or a combination of both that have strikes that are out-of-the-money.  Meaning the options have no intrinsic value; their value is entirely comprised of premium. In this sense the seller or “writer” of options is acting like an insurance company; you collect the premium but you also assume the often risk of making a large payout or loss if there an adverse event.

To offset this inherently asymmetrical risk/reward profile we need to create a situation that not only has a high probability of success but also make sure we are collecting enough premium for the risk we are assuming.  

The first and foremost way we limit and manage our risk is to never sell or short options naked.  That is always use some form of a spread. A typical credit spread involves selling a put or call and then buying a further out-of-the-money put or call for a lower price.  

An example of a basic credit put spread in Apple (AAPL) would be with shares trading $127 one could sell the $125 put for $3.00 a contract and buy the $120 put for $1.40 a contract.

This is a $1.60 net credit.  If Apple shares are above $125 on the expiration all options expire worthlessly and the $1.60 maximum profit would be realized.  On the other hand, if shares sink below $120 the maximum loss of $3.40 would be incurred.

So why would someone put on a position that can only make $1.60 but lose $3.60?  Because even if you were moderately wrong about your bullish outlook and even Apple shares declined by up to $2 or 1.5% you could still realize the maximum profit.  In fact, shares could drop by as much as $3.5 or 2.7% to $123.50 and a small profit could still be realized.

Compare this to buying a call option with the $125 which would currently cost $4.50 a contract. In this case, you need shares of Apple to rise an additional $2.50 or be at $129.50 at expiration just to break even.  

Obviously, the credit spread position has a much higher probability of achieving a profit.  To go back to the baseball analogy, credit spreads allow you to be the batter to the market’s pitcher, forcing it to do all the work by throwing strike after strike.  

The Tailwinds of Time & Volatility

Credit positions benefit primarily from time decay and a decline in implied volatility.  This makes them best suited for sideways or range bound markets, ones that exhibits a reliably steady trend or situations in which volatility levels have elevated to levels that are unlikely to persist.  

To set up a position with a high probability of profitability and acceptable risk/reward profile I use to basic parameters.

I want at least 75% probability of a profit; that means choosing the inside or short strikes that have less than 25% probability of expiring in-the-money.   While many option chains will provide probabilities of expiration a basic rule of thumb is to look at delta. I’m using strikes with a 0.20 delta, meaning they have only 20% chance of being in-the-money on expiration.

I also want to achieve a 20% return on my risk capital.   That means there must be enough premium to generate sufficient income while marinating the limited risk of a spread.

The 75% Solution

While I have the probability of profit in my favor I want to further manage risk.  I use the basic rule of thumb to close positions once either 75% of profit has been realized or a 75% loss has incurred.  

For instance, in the original Apple example above, f shares quickly rallied above $130 the value of the put spread might decline to 40c way before the March expiration.  At this point, I would look to close the position for a profit.

Conversely, in adverse moves, such as we are experiencing in the SPY condor, if the value of the iron condor climbs to $2.02 I would close the position.

You can create a sliding scale along a time frame.  Such as if a 50% profit could be realized within a matter of days it may make sense to close the position.  If you’re suddenly facing a 50% loss clearly something in your thesis of range bound or declining volatility environment was wrong and it may be best to just vacate.

But no matter the time frame, if an option you’ve sold short has declined to less than $0.10 a contract, then buy it back and cover yourself. At that point, the risk/reward becomes too asymmetrical.   Don’t try to squeeze out the last dime of premium, it would cost you multiple dollars.

To sum up this series on profit and profitability; it’s important to understand how risk is measured, knowing how to identify the fat pitches but also having in your arsenal the skill set and patience to occasionally take a walk.


‹ Older posts

©2025 StockNews.com
About Us | Contact Us | Performance | Privacy Policy | Terms of Use | Supplemental Terms

Copyright © 2025. Market data provided is at least 10-minutes delayed and hosted by Barchart Solutions.
Information is provided 'as-is' and solely for informational purposes, not for trading purposes or advice, and is delayed. To see all exchange delays and terms of use, please see disclaimer.

This site is protected by reCAPTCHA and the Google Privacy Policy and Terms of Service apply.

Information contained on this website maintained by Magnifi Communities LLC is provided for educational purposes only and are neither an offer nor a recommendation to buy or sell any security, options on equities, or cryptocurrency. Magnifi Communities LLC and its affiliates may hold a position in any of the companies mentioned. Magnifi Communities LLC is neither a registered investment adviser nor a broker-dealer and does not provide customized or personalized recommendations. Any one-on-one coaching or similar products or services offered by or through Magnifi Communities LLC does not provide or constitute personal advice, does not take into consideration and is not based on the unique or specific needs, objectives or financial circumstances of any person, and is intended for education purposes only. Past performance is not necessarily indicative of future results. No trading strategy is risk free. Trading and investing involve substantial risk, and you may lose the entire amount of your principal investment or more. You should trade or invest only “risk capital” - money you can afford to lose. Trading and investing is not appropriate for everyone. We urge you to conduct your own research and due diligence and obtain professional advice from your personal financial adviser or investment broker before making any investment decision.

StockNews, a division of TIFIN Group LLC, is affiliated with Magnifi LLC (“Magnifi”) via common ownership. Affiliates of Magnifi will receive cash compensation for referrals of clients who open accounts with Magnifi. Due to this compensation, a conflict of interest exists since StockNews has an incentive to recommend Magnifi. Please see Magnifi’s Form ADV for additional information about fees and charges that may apply.