One Of The Best High-Yield Investment Ideas You’ve NEVER Heard Of
I think we can all agree that it would be ideal to be able to fund a comfortable retirement 100% from safe and growing dividends. That way you will be able to sleep well at night even in the most severe bear market because no matter how low stocks drop your portfolio’s income would be unaffected. My own high-yield income growth retirement portfolio is based around this goal and uses three time-tested investing principles:
- High and safe yield (5+% portfolio goal)
- Fast long-term dividend growth (10+%)
- Good companies bought at firesale prices (high margin of safety and long-term valuation return boost) – average holding is 32% undervalued
Essentially I’m a dividend-focused contrarian value investors. That means always looking for the best opportunities in terms of generous, safe, and growing yield, that, for short-term reasons, Wall Street hates. The key to this strategy is to avoid “yield traps” or stocks with mouth-watering but unsafe dividends that are likely to be cut and thus send the share price crashing.
Fortunately Wall Street is famous for overreacting to a company’s short-term challenges, and thus there are usually plenty of great high-yield, deep value opportunities for long-term income investors to profit from. Let’s take a look at why Kite Realty Group (KRG) is one of my strongest conviction buys right now. Not just do I own it myself, but during the most recent market downturn, it was one of just 11 stocks I was buying for my portfolio.
Today Kite Realty represents one of the best, but little known, high-yield dividend growth stocks you can buy. One that offers not just a low-risk 7.9% yield and solid long-term dividend growth potential, but is likely to generate close to 18% annualized total returns over the next decade. That’s about double the market’s historical CAGR total return of 9.2%, and potentially makes Kite not just one of the best high-yield stocks you can own in the future, but one of the best investments of the next few years, period.
Why I Own Kite Realty And You Might Want To As Well
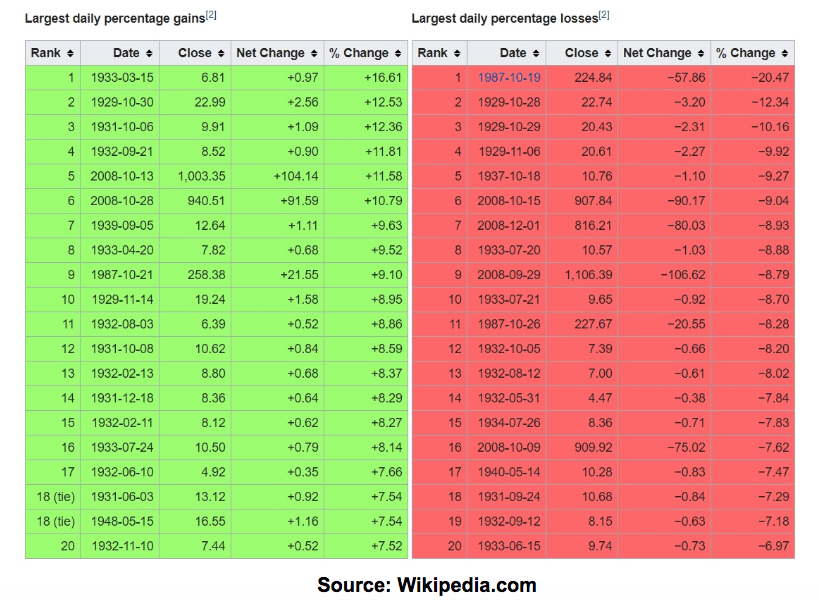
Kite Realty was founded in 1997 but IPOd in 2004. The REIT owns 115 community retail centers in 19 states. Note that KRG is NOT a mall REIT, with significant exposure to struggling or bankrupt retailers like Sears. Rather Kite’s centers are mostly focused in large, rich, and fast-growing cities. In fact, 75% of its rent comes from these primary core markets.
(Source: investor presentation)
Similarly, its retailers are not the slow-moving dinosaurs who are going bankrupt these days. 93% of its rent is from retailers who are naturally e-commerce resistant (like restaurants or gyms) or have adapted online sales into their own operations (omnichannel success stories like Walmart, Target, Lowe’s, and TJ Maxx).
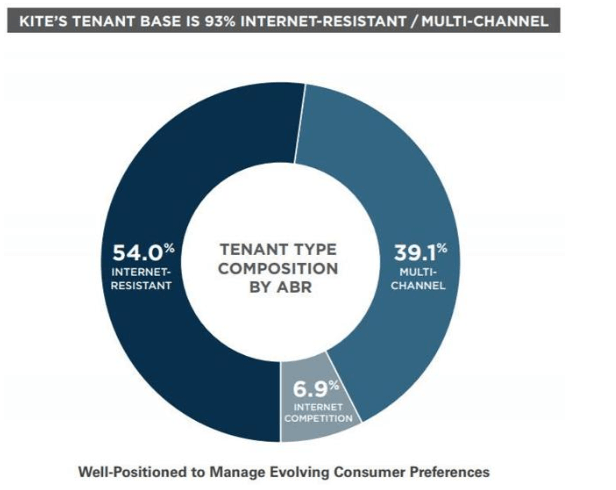
(Source: investor presentation)
The REIT is also highly diversified, with even its top 10 tenants making up less than 20% of annual rent, and most of that from thriving retailers.
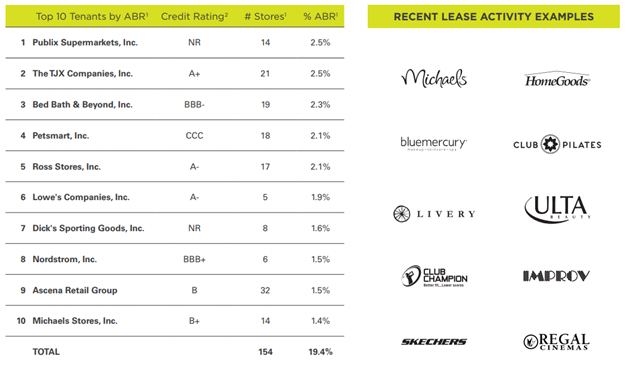
(Source: investor presentation)
Today 70% of new leases are signed with restaurants, service providers (like gyms), and other e-commerce resistant businesses. Combined Kite’s long-term leases with these retailers provide it with very stable cash flow (what REITs calls FFO or funds from operation) to pay its dividend, which currently yields a mouthwatering 7.9%. But a safe 7.9% yield is just one reason I bought this stock so aggressively during the worst month for stocks in 7 years.
Why Wall Street Hates The Stock But Why This Safe 7.9% Yielding REIT Could Make You A Fortune
Since mid-2016 Kite Realty is down a staggering 47% from its all-time high. Why has Wall Street hated this stock for over two years? Well REITs, in general, are in a bear market since long-term interest rates (10 year-yield) has risen from its all-time lows (which put REITs in a bubble).
Add to that the fact that the market’s obsession with the “retail apocalypse” has soured investors on retail REITs in general, and you get a badly beaten down share price. However, there’s one more reason Kite is so unloved right now.
That would be because in 2017 management, led by 21 year company veteran John Kite (CEO since 1997, before it IPOd), initiated a three-year company restructuring plan. This called for about $255 million in asset sales (dispositions).
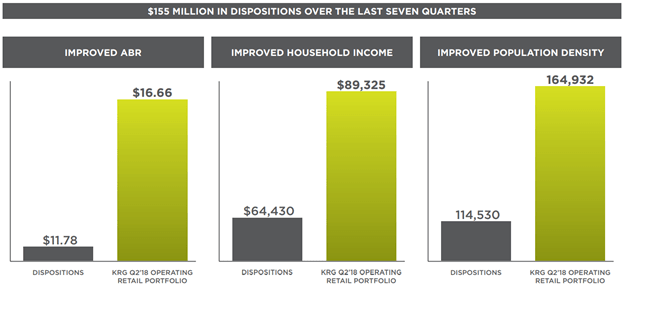
(Source: investor presentation)
$155 million of those asset sales are now complete, with the REIT selling off (at a healthy profit) its lowest quality centers. Those located in secondary markets with less population density, lower average household incomes, and that generated 42% less average base rent per square foot.
Selling income producing assets means that Kite’s FFO/share decreased 1% in 2017 and management expects it to fall 2% in 2018. In 2019 the final $100 million in asset sales are expected to cause one final 2% FFO/share decline. Wall Street HATES negative growth, especially for three years. So if Kite is technically facing declining cash flow (dividend continues to rise, however), then why do I own it and recommend it? Because of what management is using the money for.
(Source: investor presentation)
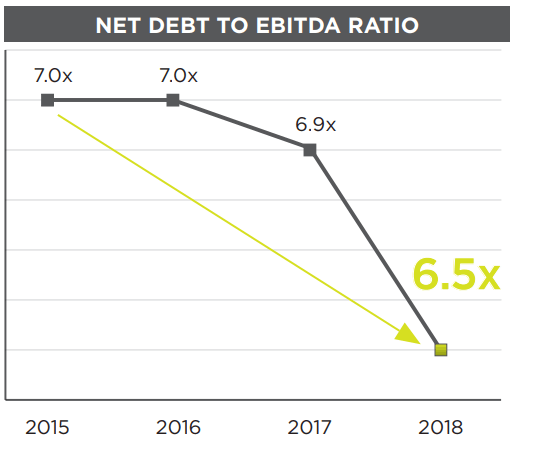
First, the REIT is paying down debt. In 2011 Kite’s net debt/EBITDA (net leverage ratio) peaked at 13.3, a dangerous level. High debt is what caused this REIT, as well as 56 others, to have to cut or eliminate their dividends during the Financial Crisis. Despite cash flow covering their payouts, credit markets slamming shut required most REITs to retain more cash, in case the credit crisis lasted for years. The entire industry has spent the last 10 years deleveraging (despite record low borrowing costs), and today the REIT sector’s debt/capital ratio is 30%, the lowest in its history (REITs were created by Congress in 1960).
Few REITs have deleveraged as aggressively as Kite, whose current leverage ratio is 6.7, down 50% from its dangerous peak seven years ago. That ratio is headed to 6.5 by the end of the year and management has said that further paying down debt is a top priority in 2019, when it completes its asset sales. Most likely that will mean Kite’s net leverage ratio falls to 5.9 to 6.1.
But even better than shoring up the balance sheet is Kite’s “3-R” investment strategy.
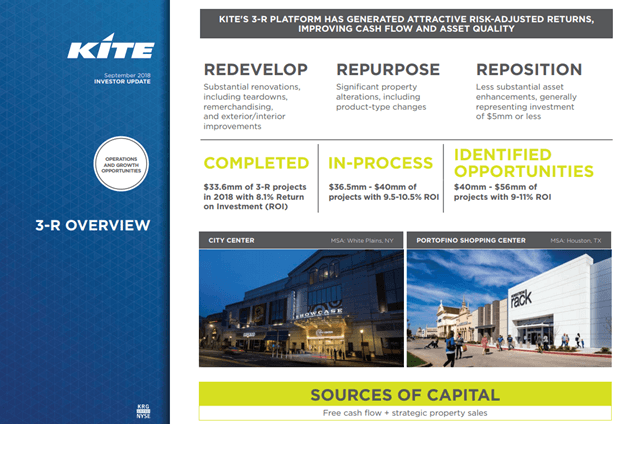
(Source: investor presentation)
The REIT is now self-funding, meaning using just its retained cash flow (FFO minus dividends = $65 million per year), plus asset sale proceeds to redevelop and improve its properties. That means not just nicer stores and centers, but also building out hotels and apartment buildings as well. These “mixed-use” properties are extra valuable since they drive higher traffic that benefits retailers via greater sales per square foot. That allows Kite to then raise rents when leases expire. In total Kite plans to spend about $121 million on these renovations in the next few years, generating between 8.1% and 11% returns on investment. That will grow cash flow by about 7% and help it to keep growing the dividend safely.
The REIT’s lease spread (how much it raises rents on new leases) is current 7.3% and 11.4% when you factor in annual rental increases built into the contracts. Double-digit lease spreads are a good proxy for quality properties that will attract and retain thriving tenants and thus generate steady and recurring cash flow to fund the dividend.
Better properties also mean higher occupancy and stronger lease spreads help to drive organic growth (what REITs call same-store net operating income or SS NOI). Yield trap REITs, with failing business models, show negative lease spreads, falling occupancy (which is typically under 90%), and negative SS NOI. On the other hand, Kite’s fundamentals are strong and moving in the right direction. For example, the occupancy rate is 93.9%, a healthy level. That’s down 0.5% in the past year mostly due to the Toys “R” Us bankruptcy. However, 40% of the space leased to that bankrupt retailer has already been re-leased, and at much higher rents. Thus this minor dip in occupancy is likely temporary. Meanwhile, SS NOI is up 1.5% for the year, and average base rent is up 5% YOY. These strong same-store fundamentals show that Kite’s business model isn’t dying, but improving, despite what the share price might lead you to believe.
But ultimately REITs are owned for their generous and growing dividends. Kite’s dividend profile is among the best in all of REITdom. That’s courtesy of a nearly 8% yield (four times that of the market) that’s low-risk. That’s due to the 64% payout ratio which is far below the industry average.
- Yield: 7.9% (vs 1.9% for S&P 500)
- FFO Payout Ratio: 64% (industry average 80%)
- 10 Year Analyst Consensus For FFO/Share (and Dividend) Growth: 4.3%
- Total Return Potential (From Fair Value): 12.2% (vs 8.3% for S&P 500)
- Valuation Adjusted 10 Year CAGR Total Return Potential: 17.8% (vs 0% to 5% for S&P 500)
And while true that the REIT’s leverage ratio of 6.7 is higher than the average REIT’s 5.8, the interest coverage ratio of 3.5 is still safely in line with the sector average (3.4). That’s why Kite has a BBB- (investment grade and stable) credit rating that lets it borrow at 4.1% (89% long-term fixed-rate bonds). 4.1% borrowing costs are less than half the returns on capital its investments are generating, showing that Kite is able to grow profitably. In fact, thanks to its high retained cash flow (low payout ratio) even after asset sales are finished in 2019 the REIT will still be able to fund all growth with retained FFO alone. Management expects that positive FFO growth will return in the second half of 2019 and by 2020 the REIT will be growing at its historical rate.
That means that in addition to a safe 7.9% yield, investors can expect long-term dividend growth of about 4% as well. Factor in multiple expansion and that translates into a nearly 18% CAGR total return over the next decade. That’s double the market’s historical return and makes Kite Realty a potential retirement maker.
Why is Kite likely to generate such amazing returns? That would be one of the lowest valuations in the sector. There are many ways to value a stock but for REITs, two are most useful. The first is to look at the Price/FFO ratio, which is the REIT equivalent of a PE ratio.
- Price/FFO: 8.1 (sector average about 16.5)
- 13 Year Average P/FFO: 12.4
- FFO/Share Growth Rate Baked Into Current Price: -0.2% (4.3% actually likely)
Today Kite trades at half the sector average, and 35% below its 13 year average (since IPO). That means that today’s price is baking in 10 years of -0.2% annual FFO/share growth. In reality management, analysts, and I, expect 4.3% growth. With such a low bar to clear, if Kite can grow at all then its P/FFO ratio will rise, its yield will fall, and investors will enjoy a very strong valuation boost. How strong? Well, that’s where the most useful dividend stock valuation method comes in. That would be dividend yield theory or DYT.
Since 1966 asset manager/newsletter publisher Investment Quality Trends has been exclusively using this valuation approach to generate decades of market-beating returns (with 10% lower volatility to boot).
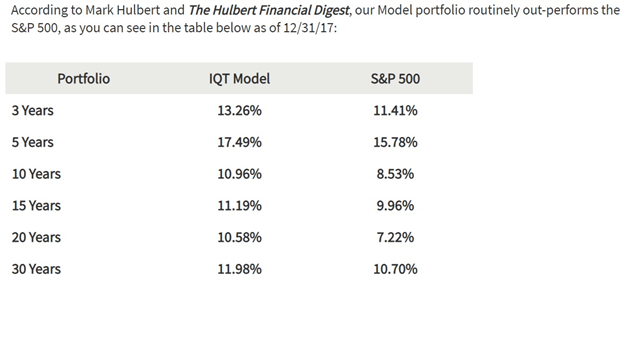
(Source: Investment Quality Trends)
DYT simply says that for stable businesses like REITs and most dividend stocks (growth rates are stable over time), yields are mean reverting. This means they cycle around a relatively fixed point that approximates fair value. A stock that normally yields 4% over time that is now yielding 5% is 20% undervalued ((5%-4%)/5%). Or to put another way, such as stock would need to rise 25% (upside to fair value yield) in order to return to its historical norm. As long as the fundamentals don’t break (business model deteriorates) nearly all dividend stocks eventually (usually within a few years) return to their fair value yield. This means that share prices rise faster than cash flow and dividends, boosting your total return to: yield + cash flow/dividend growth rate + valuation boost (annualized over how long it takes to get back to fair value).
This is called the valuation-adjusted Gordon Dividend Growth model and has been relatively accurate in predicting dividend stock total returns since 1966 (52 years).
- Yield: 7.9%
- 5 Year Average Yield: 4.3%
- 13 Year Median Yield: 4.8%
- Estimated Fair Value Yield: 4.6%
- Discount To Fair Value: 42%
- Upside To Fair Value: 72%
- 10 Year CAGR Valuation Boost: 5.6%
- Long-Term CAGR Total Return Expected: 7.9% Yield + 4.3% FFO/Dividend Growth + 5.6% valuation boost = 17.8%
Thanks to the perfect storm of short-term negative factors Kite’s yield is 72% above its fair value yield. I find that by taking the midpoint of its five-year average and 13-year median yield.
This allows us to estimate what the yield returns to if the turnaround is successful and the market stops hating the stock (market can’t ignore strong and rising fundamentals forever). This means that Kite is about 42% undervalued today, and the share price can be expected to outpace FFO/share and dividend growth by 72% over time. I can’t tell you how long that will take, but it’s almost certain to happen within the next five years. For my return model, I use 10 years. Even over this prolonged period, that means that Kite shares will likely outpace cash flow and dividend growth by 5.6% on an annualized basis. Combine that with the current yield and that’s how you get to an expected CAGR total return of nearly 18% over the next decade. Or to put another way, buying Kite today means that by the end of 2028 you could be looking at a 415% total return. All while enjoying market-beating returns from its generous dividends alone (S&P 500 is likely to deliver far less than 8% CAGR total returns over the next 10 years according to Morningstar, BlackRock, and Vanguard).
But as great a high-yield dividend growth investment as Kite is today, that’s only if you’re comfortable with the risk profile.
Risks To Keep In Mind
There are several risks potential Kite investors need to be aware of before buying this stock. First, is the fact that this small REIT, while possessing strong fundaments, is NOT yet a blue chip. Specifially, to attain the famous sleep well at night or SWAN status (in which dividend cuts even during very severe recessions are unlikely) it will have to continue deleveraging its balance sheet.
That’s because while a 6.0 net leverage ratio would be safe in the long-term, in order to obtain higher credit ratings (to BBB and BBB+), and the lower long-term borrowing costs that go with that, will require Kite to continue self-funding its 3-R strategy for several years. The good news is that the REIT’s retained cash flow is sufficient to cover 100% of investments and thus it could avoid taking on new debt (other than refinancing existing bonds and credit facilities). The rising cash flow would then lower its leverage over time, and make the overall balance sheet (and dividend) even safer in the coming years.
However, thus far management has only said it is committed to paying off debt through 2019 when it will complete the last of its asset sales. Thus I’ll be watching closely in 2020 and beyond to see what kind of capital allocation decisions management makes. Theoretically, the REIT might take on additional debt in order to acquire new properties or even make an acquisition of a smaller REIT. Such M&A activity always comes with execution risk, including possibly overpaying for an asset and increasing the leverage ratio headed into a future recession.
Speaking of recessions, here there’s good and bad news. The good news is that the current payout ratio and debt levels mean that, barring an even worst Financial Crisis than last time, Kite isn’t likely to cut its dividend in the next economic downturn. BUT while 93% of its tenants are e-commerce resistant, not nearly as many are recession proof. While it does have plenty of strong defensive anchor tenants (like Walmart, Target, dollar stores, and discount retailers), many of its tenants might see their business decline when the economy next shrinks. That will likely mean that FFO/share once more turns negative, which Wall Street will likely punish with a sharply lower price.
What’s more, while the dividend is likely to be maintained (I wouldn’t own it if I weren’t highly confident of this), it may be frozen for the duration of the recession. That would further weigh on the share price. Of course, in that scenario (where KRG’s yield soars to 10+%) I’ll be adding more by the bucket full. But investors who are very uncomfortable with such volatility need to keep this in mind and size their positions accordingly.
Finally, due to its still relatively large exposure to secondary (smaller, less dense, and less affluent) markets, Kite’s lease spreads remain weaker than rivals like Brixmor (BRX) and Kimco (KIM), both of which I also own. Remember that lease spreads are a proxy for the quality of a retail REIT’s asset base. Should KRG’s lease spreads fall below 10% for a long period of time that would call into question management’s current 3-R strategy. And of course, those lease spreads will naturally decline during a recession. That’s why it’s good that the final $100 million in property dispositions should greatly boost this REIT’s property quality and allow it much higher lease spreads, at least in theory. But investors will want to make sure that this important metric actually goes up (it’s found in the earnings releases) in the coming quarters.
Bottom Line: At Today’s Price Kite Realty Is One Of The Best High-Yield Investments You Can Make
Don’t get me wrong, Kite Realty, like all stocks, faces its fair share of challenges and is not a risk-free investment. But the current fundamentals mean that its 7.9% yield is likely safe, even during the next recession (why I own it in my portfolio). Meanwhile, management’s plan to self-fund a large number of highly lucrative property improvement projects is likely to lead to strong cash flow and dividend growth in 2020 and beyond.
When you combined Kite’s nearly 8% yield, with its 4% long-term growth potential, and then add in shares trading at a 42% discount to fair value? Well, you get the potential for not just generous, safe, and steadily rising income, but likely about 18% long-term CAGR total returns as well. That’s not just a fantastic return (and likely to beat the market by three or even four times in the coming years), but makes this little known, and highly unloved REIT one of the best investments you can make at this time.
That’s as long as you are patient enough to wait for the turnaround to succeed, are comfortable with the risk profile, and have a long enough time horizon (5+ years).